Accessibility Settings

color options

monochrome muted color dark

reading tools

isolation ruler

Tag

covid

6 posts
Forbidden Stories' Pegasus Project exposé

Data Journalism

Data Journalism Top 10: Pegasus, Silencing Reporters, Europe Flooding, Diversity Mapping, K-pop

Our NodeXL mapping from July 12 to 18, which tracks the most popular data journalism stories on Twitter each week, found a series of articles resulting from the collaborative project that analyzed an unprecedented leak of more than 50,000 phone numbers selected for surveillance. In this edition, we also feature an insight into Facebook’s data wars by The New York Times, an interactive piece by Al Jazeera on how the holy city of Mecca has expanded, and a colorful project by the Washington Post on the rise of K-pop.

Data Journalism

Data Journalism Top 10: China’s Gene Data, Norway’s Terror, India’s Sugar, Space Tourism

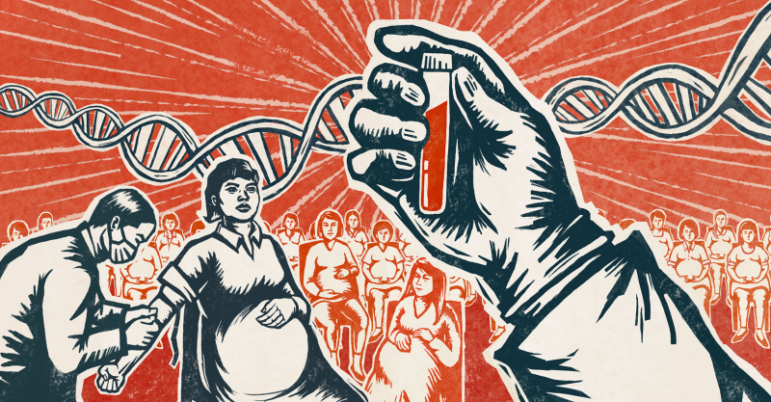
Ten years ago, terror attacks in Norway claimed the lives of 77 people and seriously injured at least 40. Our NodeXL mapping from July 5 to 11 found an interactive timeline piece by Norwegian newspaper Verdens Gang telling the story of a tragic event that impacted an entire nation. In this edition, we also feature an investigation by Reuters into a Chinese company harvesting genetic data from pregnant women, a series on gun violence in Chicago by The Trace, and a look at “silent” Russian politicians by IStories.

Data Journalism

Data Journalism Top 10: Chinese Propaganda, Social Media Abuse, Herd Immunity, Florida Condo Collapse, Pandemic Plastic

With less than a month until the start of the Olympic Games, host country Japan’s slow vaccination campaign is causing concern. Our NodeXL mapping from June 21 to 27 found a piece by The New York Times looking at Japan’s efforts to combat the pandemic in the run-up to a global sporting event. In this edition, we also feature a joint investigation by ProPublica and The New York Times into Chinese propaganda on the internet, a herd immunity calculator by German newspaper Zeit, and revelations from the Guardian about abusive posts on social media targeting English soccer players.

Data Journalism

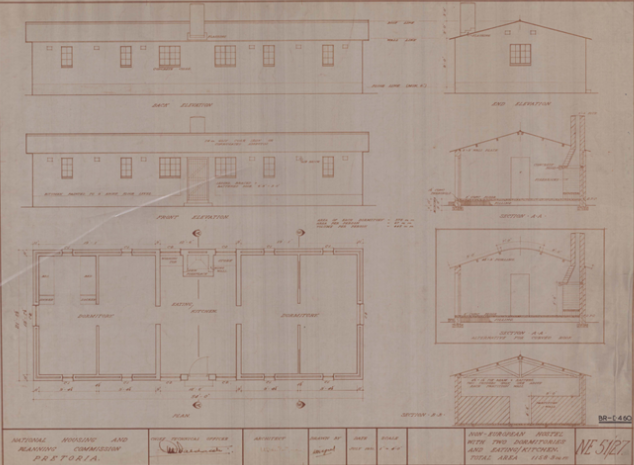
Data Journalism Top 10: Apartheid Architecture, Night Trains, Conflict Reporting, LGBTQ & Refugee Vaccines

Would you board a night train instead of a plane in order to help protect the environment? European policymakers hope more and more citizens will do so. Our NodeXL #ddj mapping from May 3 to 9, found an article by Bloomberg analyzing a plan to drastically cut greenhouse gas emissions by rolling out more cross-border rail lines. In this edition, we also feature a multimedia project looking at an architectural phenomenon linked to apartheid in South Africa, a Washington Post story about the true toll of the coronavirus pandemic in Mexico City, and a guide on using data in conflict reporting.

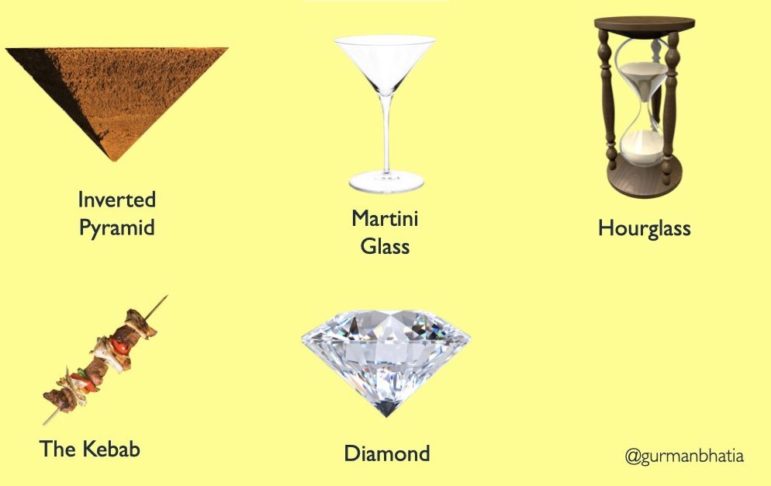
Structuring visual narratives, by Gurman Bhatia

Data Journalism

Data Journalism Top 10: Women’s Careers, Vitamin D, Visual Stories, Electric Cars, Japan’s Ghost Towns

On the one-year anniversary of the COVID-19 crisis being declared a global pandemic, outlets around the world looked back on how the coronavirus has transformed our lives. Our NodeXL #ddj mapping from March 8 to 14 found a comprehensive summary of how the health crisis unfolded in the United States by The Washington Post, and a look at the COVID-19 crisis in Hungary. In this edition, we also feature The Economist’s interactive tool estimating the risk posed by COVID-19 based on a person’s health, a story about the ghost towns in Fukushima by NPR, and an analysis of the future of electric cars by The New York Times.

Resource

How Reporters Can Flatten the Stress Curve While Covering the Pandemic

At first glance, the COVID-19 story appears overwhelming at every professional and personal level for individual reporters, from psychological trauma and shelved investigations to the health risks to their families. But experts say planning and daily habits can make the work manageable — and that the work itself, and the sense of making a difference, represents a coping strength that reporters can exploit.