
This Week’s Top 10 in Data Journalism
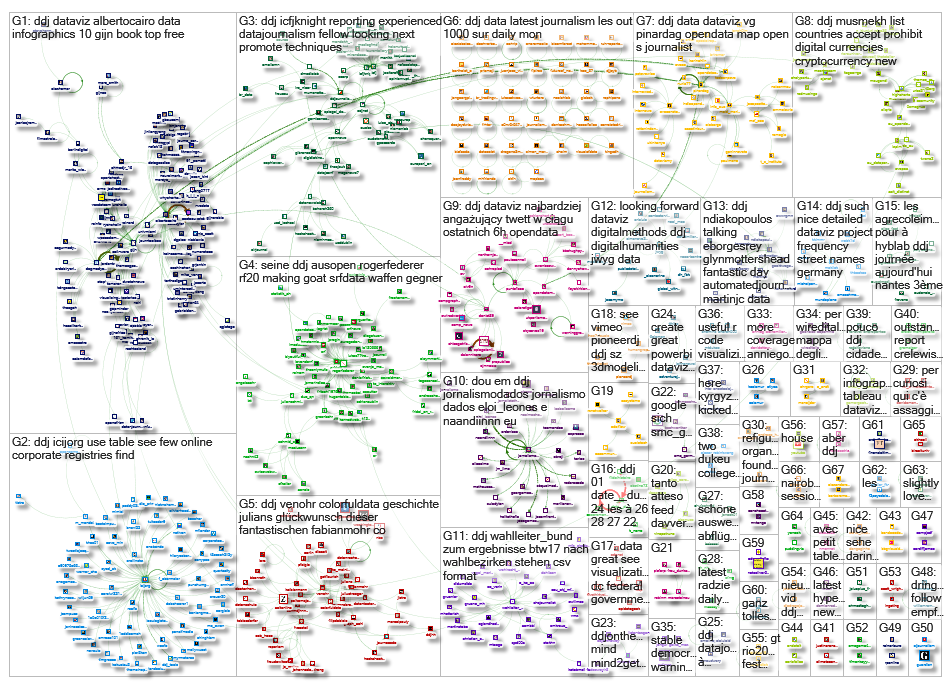
 What’s the global data journalism community tweeting about this week? Our NodeXL #ddj mapping from January 22 to 28 finds a gorgeous data visualisation of German streets by @zeitonline, a detailed data analysis of Roger Federer’s tennis career by @srfdata and a look at eight alternatives in redistricting US voting boundaries by @FiveThirtyEight.
Street Names Unlocked
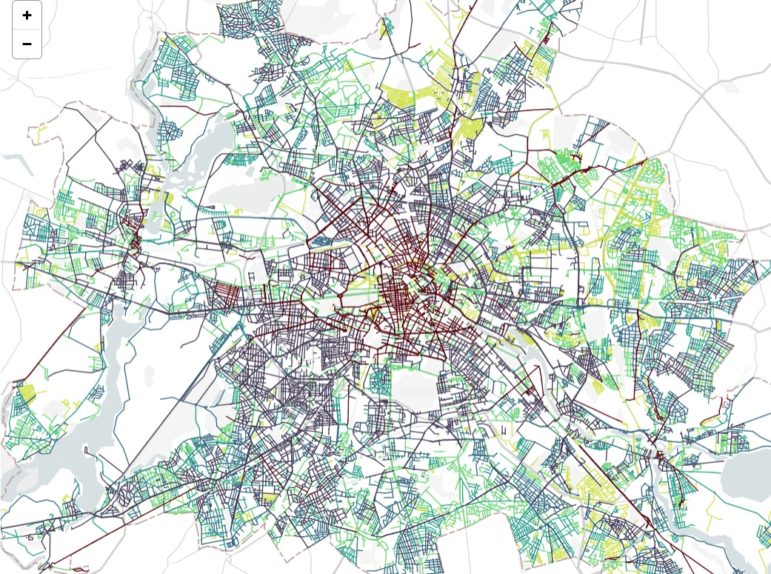
What’s in a street name? Romans, emperors, socialists? In this gorgeous data visualization, Zeit Online discovers the historical background and geographic patterns behind 450,000 street names in Germany.
.@zeitonline just launched a beautiful, beautiful #dataviz piece about the regional frequency of street names.
By @kaibiermann, @colorfuldata, @AstridGeisler, @flaviogortana and many more. Only in German, but have a look anyway: https://t.co/F1k4iQY0da pic.twitter.com/0JFhQGU95p
— Lisa Charlotte Rost (@lisacrost) January 25, 2018
Roger Federer’s Career Analyzed
One motto of Roger Federer that is often quoted goes: “Play with respect. Win with grace.” SRF Data has a detailed data analysis of his 20-year-long tennis career, showing his steady rise to the top to his decline, and later comeback.
20 years – 20 titles: A data analysis of @rogerfederer‘s career. https://t.co/l69glhhbLq #ddj #RStats #AusOpen #RF20 (by @srfdata and @swissinfo_de)
— Timo Grossenbacher (@grssnbchr) January 28, 2018
Gerrymandering
A team at FiveThirtyEight built interactive maps for every congressional district in the US to show eight different redistricting scenarios which could radically alter the partisan and racial make up of the House of Representatives.
We gerrymandered the entire country 7 different ways. Here’s the current House and then … https://t.co/JZ3vLZK4ih pic.twitter.com/OtF11SPHo0
— Micah Cohen (@micahcohen) January 25, 2018
365 Days of Trump
What did Donald Trump achieve in his first year as President? How many times did he make false statements? How did the economy develop? How much time did he spend on the golf course?
1 Jahr #Trump in Zahlen. Tolle Arbeit der Kollegen beim @tagesanzeiger ?? #ddj #infografik https://t.co/wWPEY0nq0D
— Martin Oswald (@oswaldmartin) January 22, 2018
Sports Data Journalism
What’s the difference between a sports data journalism project and any other data project? Where do you find data and analytics on this topic? Marianne Bouchart speaks to four experts — Steve Doig, Paula Lavigne, Nassos Stylianou and Malcolm Coles — to find out.
Winter Olympics 2018 are a few weeks away… How do you get ready for these sporting events? What’s the difference between a sports #datajournalism project and any other data project? Where do you find data and analytics on this topic? https://t.co/3IHimj1RaZ
— ODI Madrid (@odi_madrid) January 25, 2018
Offshore Leaks Database Tutorials
ICIJ’s Offshore Leaks Database, with data on more than 680,000 entities and 600,000 directors and shareholders, is a starting point for investigating activities offshore. ICIJ has written three tutorials on how to search and maximize the use of its database.
RT: @icijorg :Tips for digging through our data: #1. Download and cross reference. https://t.co/OK1mltdNYk #ddj
— noticias venezuela (@notiven) January 26, 2018
Measuring Open Data
Robert Palmer lists several tools for assessing how well national governments are sharing open data, including the Open Data Barometer, Global Open Data Index and OECD OURdata Index.
Great article by @robertnpalmer that looks at the four tools for assessing #opendata publication & maturity. https://t.co/zrKwY1hNHH pic.twitter.com/1kyZq7Jx0Y
— Drew Mingl (@drewmingl) January 25, 2018
Downloadable German Election Data
For the first time, the results of the Germany’s federal election by electoral districts will be available as a free download on the website of the Federal Returning Officer. All data are provided in CSV format.
In vielen Staaten bei Parlamentswahlen selbstverständlich – in Deutschland nun zum ersten Mal kostenfrei: Die Ergebnisse der Bundestagswahl in allen 88511 #Wahlbezirken in einem maschinenlesbaren Format zum Download https://t.co/AkXAt0mu4T #ddj #btw17 pic.twitter.com/dl72qJgsgm
— Wahlrecht.de (@Wahlrecht_de) January 26, 2018
Mapping Digital Currencies
Mustapha Mekhatria’s mapping project shows the countries in which digital currencies are allowed, prohibited or officially acknowledged.
List of countries that accept or prohibit digital currencies.https://t.co/jgdRyyP97W by @MusMekh #cryptocurrency #ddj #dataviz pic.twitter.com/gfSQ0dkqzV
— Highcharts (@Highcharts) January 22, 2018
Data Dialogue
Data Intersections is an experimental (and free!) one-day event in Miami, where six people from journalism, data science, artificial intelligence and the digital humanities chat about data’s influence and their thoughts about the promises or challenges data poses. Find out more in Alberto Cairo’s blogpost here.
@albertocairo introduces a new (and free) conference: Data Intersections #DataScience #dataviz https://t.co/vdF12T3Zjj pic.twitter.com/KOEfES5FDF
— Blue Aster Studio (@BlueAsterStudio) January 24, 2018
Thanks, once again, to Marc Smith of Connected Action for gathering the links and graphing them.


