Image: Shutterstock
Tips for Investigating Hate Crimes and Violence When Government Data Sources Fail
Read this article in
The National Crime Records Bureau (NCRB) in India, which has been tracking and publishing the country’s crime statistics since the 1980s, stopped tracking religious killings and farmer suicides in 2017. This leaves no way of checking on whether either of these is trending upwards, although the frequency of reports in the media would suggest, anecdotally, that they are.
Image: Screenshot
Similarly, there is no official tracking of hate crimes. An attempt was made in 2017 by the Hindustan Times to start a hate tracker to document victims, but under government pressure the tracker was taken down. Editor Bobby Ghosh was asked to step down. A similar fate met the Hate Tracker created by online website IndiaSpend, and its editor Samar Halarnkar also resigned.
In my fellowship project at the Reuters Institute for the Study of Journalism, I worked under the guidance of communication researcher Dr. Sílvia Majó-Vázquez to take in key lessons about how journalists can reliably step in to gather, clean, and publish data when the government fails to do so.
Sourcing the Data
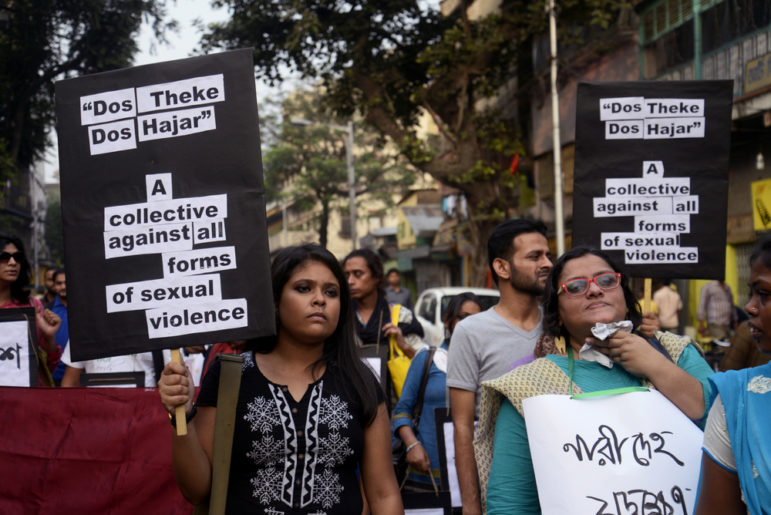
First, I defined what would count as a hate crime: criminal acts committed with a bias motive in relation to a group characteristic of the victim such as race, ethnic background, religion, gender, physical or mental disability, or sexual orientation. Then I scoured English language news media for reports of hate crimes between January 1, 2014 and December 31, 2020, copying links and noting details about each attack into a spreadsheet.
I excluded riots, because I did not have the time or resources to catalogue these fully. I excluded social media reports, because I didn’t have the resources to independently verify them. Finally, I excluded regional-language news outlets because I didn’t have the resources to accurately translate all of them.
The result is a Google Sheet with 212 incidents of hate crime reported in English-language media. Wherever possible, I have catalogued details such as the date, type of violence, gender, caste, and socio-economic details of victims and perpetrators, as well as their religion, politics, and the police response. I then analyzed the data for patterns and trends. You can download the full report for my findings.
In any database like this one – a database that relies on available sources, instead of sampling among all known occurrences – we cannot claim that the data is representative. The value of the cases I gathered speaks only to the characteristics of those that were recorded in English language media, and it also highlights the need to independently curate a comprehensive database for a better understanding of the prevalence and characteristics of hate crimes in India.
If you are planning to create your own database to plug a gap in official reporting, but don’t have the luxury of working with a communications researcher like Dr. Majó-Vázquez, I have gathered some helpful lessons from my time working with her.
1. Make Sure Your Data Sheet is Workable
In the beginning, I was very keen on adding every little detail about each case. For example, when documenting the profession of the victim, I would specify whether the person was a meat seller, IT worker, a farmer, or a student. This resulted in nearly 40 categories of work, which didn’t give a sense of the socio-economic class of the victim. With Dr. Majó-Vázquez’s help, I narrowed down the professions of the victims to just five variables: blue-collar worker, white-collar worker, student, religious workers, and other. This let me create a clearer picture of who was most likely to be targeted in a hate crime.
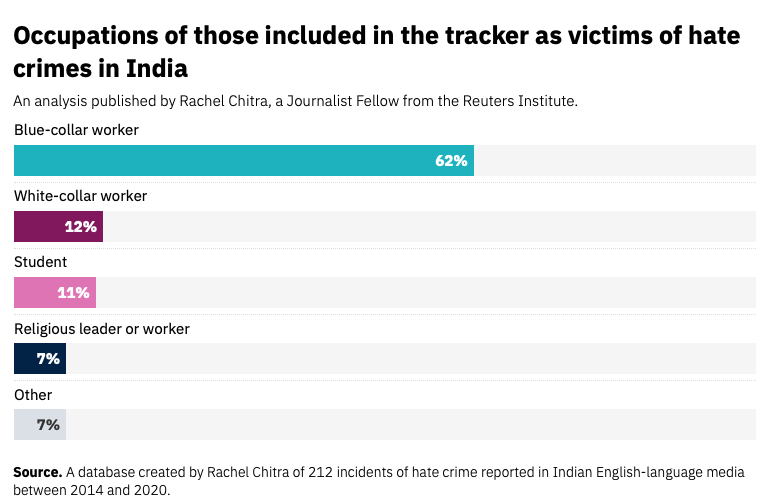
Image: Screenshot
2. Prepare for Preconceived Ideas to be Challenged
Your database could surprise you out of preconceived notions, but you cannot exclude or include data to confirm your own preconceptions without rendering your work useless.
3. Beware of Typos
It sounds like a small issue, but one or two typos can make a worksheet unsearchable. For example, under region, Uttar Pradesh spelled as “Utar Pradesh” meant that it would pull up as a different state while trying to filter search results. Copy editing is dull work, but it meant that I and others could easily analyze the data.
4. Delete Columns That Do Not Have Enough Data
Initially, I had columns documenting ethnicity of victim, sexual orientation, and the number of passive observers of the crime. In the case of the first field, the information became so repetitive as to be redundant. I realized that the nationality of the vast majority in the attacks was Indian, and that filtering for this information would not be of use. In the case of the second two fields, the information was available so rarely that the columns were no longer useful, because the available data would not be representative. Focus on the data that is available within your set.
5. The Need for Footnotes
While it makes sense in a database to refer to the Vishva Hindu Parishad [a Hindu religious organization] as the VHP, I often had to explain my acronyms and shorthand to others. Use a separate sheet or the comments tool to store footnotes about acronyms or links to explainers. This adds clarity so that anyone using the dataset will understand, without “breaking” your filters or cluttering your data set.
6. The Value of Brevity
In a database, I realized some of the easiest searches happen with columns that are in the yes/no format. For instance, did the police file a First Information Report (FIR, the equivalent of a police complaint): yes, or no? Did the police file an FIR against the victim or the perpetrator? By inputting the answers to such questions, I was able to see some unexpected results, for example: police filed FIRs against both the victim and perpetrator in 13% of cases.
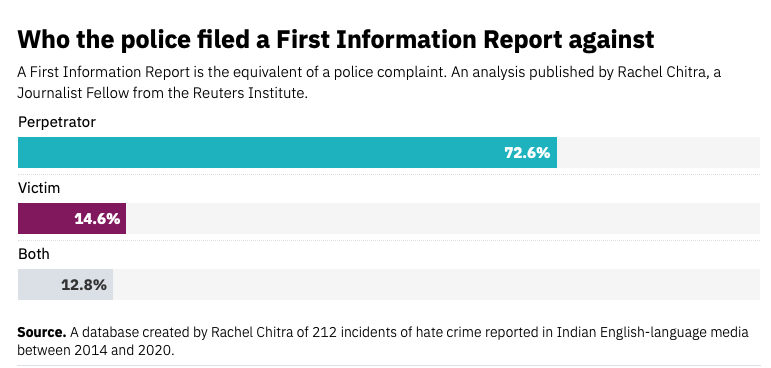
Image: Screenshot
Filling the Void
The list of information that India’s current government withholds from the public keeps getting longer. I can envision independent journalist teams collecting data on topics like how many health workers have been infected with COVID-19, the number of rural child-care social workers who left their jobs during the pandemic, the number of school dropouts, the closure of small- and medium-sized enterprises, the number of attacks on Right to Information activists, and many other stories that require careful monitoring and data that may not be forthcoming from official sources.
In response, other journalists, academics, and activists in India have started creating databases because of the growing void in official data on crucial issues. For example, Article 14 created a Decade of Darkness database project, in which it documents the number of sedition cases filed in the past 10 years. An increasingly common intimidation tactic in India involves the current government accusing journalists and activists of sedition and being “anti-national.”
Conclusion
My hope is that this paper helps journalists think about how they define the questions they want to answer, how they collect the data, and how they report on it.
Work on the hate crimes tracker is by no means complete: I intend to take it online and invite other journalists to gather and catalogue information. It currently only includes reports from English-language outlets, and could be dramatically expanded if we were to include regional language reports too.
The risk to quality of information in crowdsourced projects like these lies in duplication of entries, authentication of the reports, and implicit bias in the interpretation of results. With full awareness of those risks – and the security risks to those who try to keep tallies – I believe it is still worth trying.
This article was originally published by the Reuters Institute for the Study of Journalism. GIJN added a small amount of additional material from the author, including from the full paper.
Additional Resources
Interpreting Data: Tips to Make Sure You Know How to Read the Numbers
How One Mexican Data Team Uncovered the Story of 4,000 Missing Women
 Rachel Chitra is a finance journalist and special correspondent for the Times of India with a passion for using data to tell human stories. She has previously worked for Reuters, New Indian Express, and Deccan Chronicle. Her project for the Reuters Institute looked at the documentation of lynching and rape of Muslims and Dalits in India.

Investigating Latin America’s Global Reach Of Illicit Activities

Step-By-Step Guide for Journalists on the Basics of Google Sheets

Investigating the Israel Hamas Conflict

Tipsheet for Using Ocean Data in Your Investigations

How a WhatsApp Community Is Bringing India’s Data Storytellers Together

One Name at a Time: How Die Zeit Built a Searchable Database of Nazi Party Members

Building a Multi-Agent AI System To Sift Through Thousands of Russian Social Media Posts

How to Tell the Stories of People Behind Data Points

This work is licensed under a Creative Commons Attribution-NoDerivatives 4.0 International License
Republish our articles for free, online or in print, under a Creative Commons license.
Republish this article
This work is licensed under a Creative Commons Attribution-NoDerivatives 4.0 International License
Read Next
Data Journalism
How a WhatsApp Community Is Bringing India’s Data Storytellers Together
Recently, more than 400 people gathered in the Indian city of Bengaluru for VizChitra 2026, a conference on data visualization and storytelling — but that is only a small part of the story.
Data Journalism
One Name at a Time: How Die Zeit Built a Searchable Database of Nazi Party Members
An online tool set up by the German newspaper Die Zeit, in cooperation with archives in Germany and in the United States, allows people to search several million Nazi Party membership cards.
How They Did It News & Analysis
Building a Multi-Agent AI System To Sift Through Thousands of Russian Social Media Posts
The system built by BBC Eye allowed a team of open source specialists and reporters to accelerate their investigation of Russian ultra nationalists and their political impact.
Data Journalism Methodology
How to Tell the Stories of People Behind Data Points
At the NICAR26 data journalism summit, a panel of veteran data reporters shared tips on how to amplify and contextualize data-driven public interest stories with ordinary people at the short end of policy.