
Illustration: Smaranda Tolosano for GIJN
Introduction to Investigative Journalism: Data Journalism
Guide Resource
Guide: Introduction to Investigative Journalism
Chapter Guide Resource
Introduction to Investigative Journalism
Chapter Guide Resource
Introduction to Investigative Journalism: Interviewing Techniques for Beginners
Chapter Guide Resource
Introduction to Investigative Journalism: Following the Money
Chapter Guide Resource
Introduction to Investigative Journalism: Data Journalism
Chapter Guide Resource
Introduction to Investigative Journalism: Fact-Checking
Chapter Guide Resource
Introduction to Investigative Journalism: Digital Security
Chapter Guide Resource
Introduction to Investigative Journalism: Collaborations
Chapter Guide Resource
Introduction to Investigative Journalism: Editing: The Investigative Article
Using data in journalism is not new. But over the past decades, it has come a long way. In the 1960s, Philip Meyer began experimenting with the use of computers to process data for various projects at the Detroit Free Press. He also introduced the use of social science methods in reporting, later detailed in his 1973 book, “Precision Journalism: A Reporter’s Introduction to Social Science Methods.”
Over time, more journalists started to follow Meyer. In 1989, with the support of the Missouri School of Journalism in the United States, Investigative Reporters and Editors (IRE) started the National Institute for Computer-Assisted Reporting program. From then on, journalists began to receive training on how to use data in their investigations, or even create investigations from data.
In the ensuing decades, as the use of the internet spread and increasing amounts of data emerged, journalists began to use the term “data journalism” to describe reporting (as well as investigations) in which data gathering and analysis was a key part of the process, helping to uncover systemic issues, identify patterns as well as outliers, while reporting stories of public interest.
As a result, computer-assisted reporting became a global practice, as former IRE executive director Brant Houston noted: Journalists worldwide, individually or as part of regional or even international organizations, began to use it to conduct investigations. At the same time, universities and organizations around the world, such as the Global Investigative Journalism Network, began to offer training on data journalism.
Now, 60 years after Meyer began experimenting with computers, many investigative projects are the result of processing large numbers of records and conducting data analyses with computers, combined with traditional reporting techniques such as speaking to human sources, reporting on the ground, and accessing public records and documents to produce stories of public interest.
Where to Find Data
Data is everywhere. Because of advances in technology over the past decades, people can store and process more information than ever before. Meanwhile, data can come in aggregate or granular form. Of course, journalists often prefer to obtain granular data so it can be analyzed from all angles. Even so, that’s not always the case.
Still, many governments are embracing making data public. Here are some sources to start with:
- Business registries
- Court records
- Property registries (brick and mortar, intellectual)
- Official gazettes. These are public in most jurisdictions
- Scraped public databases from government or NGO websites. (However, make sure you familiarize yourself with the legalities of the jurisdiction or the companies that host the data, as some have restrictions or special considerations in regard to scraping.)
- Mining concessions. Even opaque countries such as the DRC and Burkina Faso publish mining information through systems that manage land rights and restrictions.
- Updates from government officials and law enforcement through their social media, websites, and official channels, like the example in this link.
- International organizations like the United Nations
If an organization or a public agency publishes a figure (such as a statistic), asking for the data behind it could also be a way of accessing a dataset.
Some examples of publicly available datasets include:
- UK Land Registry
- Carbon offsets and credits database
- CITES trade database
- Congo Mining Cadastre (registry)

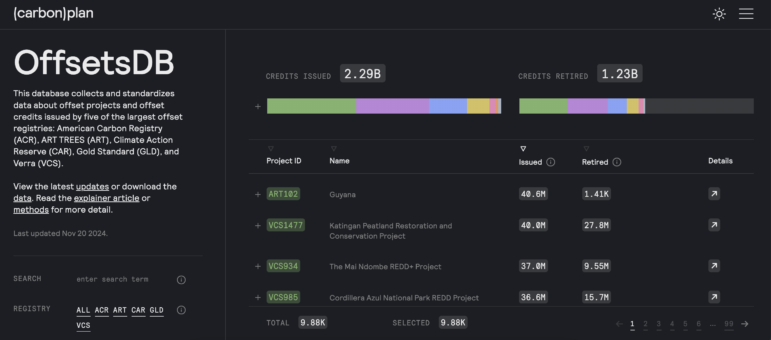
Carbonplan’s Offsets database was designed to make it simpler to investigate carbon offsets and credits and collects data from five of the biggest offset registries. Image: Screenshot, OffsetsDB
The Process
Data journalism is more than just producing charts and infographics. It is also more than just working with structured data in spreadsheets. It is using data to uncover what has been hidden and drive the reporting to create a story with impact.
To use data in your stories effectively, first ask yourself:
- What is the nature of the source of the data: Where and how is the data stored?
- Is the data structured or unstructured?
- What is the focus of the story, and in what format will it be told?
- What is the capacity of your team?
- What data is available? If none is, can it be created?
Then get busy:
- Get the data. Once an idea has proved worth pursuing, the next step is to obtain the data. Journalists get data from a leak of a dataset or documents, from initiating FOIA requests, from human sources, from programming to scrape data from documents or web pages, or from extracting it from PDFs and other image documents. Then comes the task of transforming it all into structured data that can be easily analyzed.
In some cases, journalists may need to create their own dataset if it doesn’t already exist in a structured format — via documents or other sources, for example.
- Understand the nature of the data. Ask who created the data, in other words, determine the source of the data, validate their credentials, and assess their credibility. Read the documentation behind the data source to figure out how the data was gathered. Also determine if the data is from a primary dataset or a secondary dataset created from other data sources. What does the data contain (understand the variables, what they represent, and how they are stored). Determine if the data you have is the full dataset or only a portion.
Afterward, try to understand what questions the data you have can answer. Pay attention to what is missing that may have to be filled in by additional data sources. Explore if there is another dataset you would like to obtain to enhance the original set or to compare it with.
- Verify the data. Make sure that the data you have obtained is authentic and can be confirmed. Data can be verified by cross-referencing it with other datasets, checking other documents, and speaking to experts. Later in the reporting process, journalists should contact the individuals or entities directly mentioned in the datasets for comment and verification.
When working with data you may face challenges such as data accuracy, completeness, and inconsistency. It’s critical to check if there are any issues with the data, and whether the information is not authentic, outdated, or incomplete. Otherwise, your story may rest on a house of cards.
- Document and safeguard the data. If you end up restructuring the data, remember to make a README file, known as a document of instructions, about the data and your methodology. Keep notes of your processes while working with the data. This will help to reduce errors. Keep a copy of the original data — in case of an error, it’s possible to trace it to its origin.
Also, determine who is working with the data. Depending on the sensitivity of the data, it’s important to decide who will access the data and how it will be shared. Data can be stored in folders, on a Google Drive, via a flash disk (if too sensitive to store on the internet), via databases e.g. shareable sql databases or using advanced tools like Aleph, Datashare, NINA, etc.

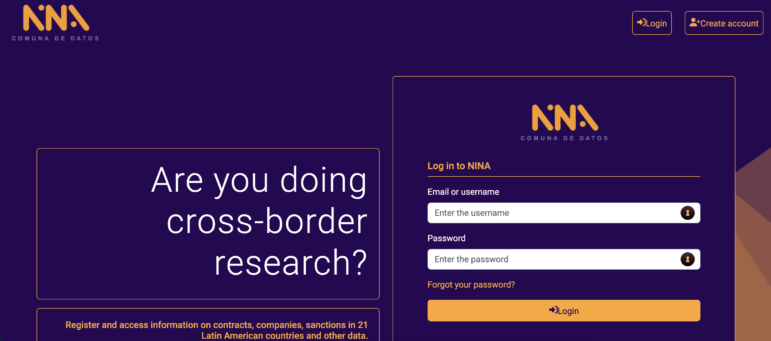
NINA, the data platform of the Latin American Center for Investigative Journalism (El CLIP). It connects open databases to simplify finding connections between companies and individuals contracted by Latin American governments. Image: Screenshot, NINA
The Organized Crime and Corruption Reporting Project (OCCRP) and the International Consortium of Investigative Journalists (ICIJ) usually share data with every journalist working on a project to facilitate efficient collaboration. Still, these organizations have strict protocols determining who can access a dataset to avoid putting sources or reporters at risk, while also ensuring everyone with access has all the information and context necessary to understand the dataset completely. In other words, only share the data with those who must have access to it.
- Analyze the data for insights. Once you have understood the data and have shared it with other collaborators, it’s time for happy digging. Always treat data the way you treat human sources — interview the data. Ask yourself, what questions can the data answer, and document how you arrive at those answers:
- Keep a data diary of the steps taken to arrive at a value or insight. This will help during fact-checking or if you are asked questions by editors — or lawyers.
- Also, use self-referencing and reproducible processes to answer questions later. These could include the use of Excel formulas instead of copy-pasting data; the use of programming codes; the use of a GitHub repository or other methods to keep track of the work.
- Record your findings in a way that you and other team members can follow easily. Develop systematic methods to store your calculations, for example, via spreadsheets, dashboards, Python code, or a wiki page.
As part of the analysis, it is possible to cross-reference the information with other datasets. For example, cross-referencing data from entities registered in offshore jurisdictions that appeared in the Pandora Papers with data from land registries in the United Kingdom, France, and the United States (California, Miami, and other states) helped uncover many properties secretly owned by politicians and public figures during the investigative collaboration between the ICIJ and more than 150 media partners.
6. Check your findings with additional reporting. Data analysis must be proofed to ensure that the findings make sense. These need to be reviewed against available laws and regulations, or even past research and reporting. Talk to experts and check your analysis with your colleagues.
Then ask yourself:
- Does the data expose any wrongdoing (money laundering, corruption, tax evasion, environmental violations, or other crimes)?
- Are there any problems with the validity of the data?
- Does the data contain new information?
- Does the data help illuminate a systemic issue?
- Is there a surprising outlier in the data that could become an important story?
Finally, as the saying goes, “if you torture the data long enough, it will confess to anything.” Statistics can be manipulated to support any conclusion. Avoid this.
7. Plan for publication. Once you have completed your analysis, plan time to fact-check the results of your data work, write the story, and review that the data is presented in the right context. As with other investigative pieces, schedule a legal review and allocate time for production. Are you planning to publish a visualization or an interactive with your story? Include that in your plan too.
From the Data to the Story
A data story can start the same way other stories do: during the course of reporting another story, a leak, or even observation – some issues of public concern can also drive the production of data that lead to stories.
In these cases, data often drives the stories.
Still, while combining data reporting with traditional reporting can produce very powerful results, it’s important to keep in mind the human component and the public interest. Why would the audience be interested in the story? What systemic issue is it uncovering? Who is affected by that issue?
From data to the story: a checklist
1. Identify your story angle. After analyzing data, you may get overwhelmed by the findings and also have numerous angles to choose from to pursue. Thinking about the pitch might help narrow down the best angle to choose.
If you are still lost, talk to your colleagues or your editors. Fresh eyes can help narrow down the best angle to choose, produce a new one and get valuable feedback.
2. Storyboarding and story planning
Mapping the findings into a storyboard helps organize and define the aspects of a good story such as the characters, the conflict, the plot, the structure, etc. What is the engaging storyline in your key findings? Map it out.
3. Write the pitch. Lay out where the data is leading you so others including editors can understand it and get on the same page.
4. Report the data. Keep in mind that great data stories are also accompanied by great reporting. Here’s an example of where the reporting became the story from the data: Imagine you are analyzing housing projects in your country with a deep look at the government’s investment and the companies contracted to build the housing. While visiting the sites of the housing projects, as dictated by the data, you find there are no buildings. In this case, the discrepancy between the data and what happens in the field becomes the story.
5. Write the story. The biggest challenge for data-driven stories is bringing the findings to life through coherent and engaging stories. It may be helpful to outline or diagram the story before you start writing.
6. Data downloads, clarifications, and visualizations: While planning for publication, consider if there is any data that can be made publicly available or shared with the audience to enhance the readers’ understanding of the topic. It can be presented through an interactive graphic, and if possible, one that allows the readers the ability to download the data. It is also important to consider writing a methodology companion piece that explains the nature of the data, and how the work with the data was conducted.
Keep in mind: Audiences don’t always care about raw data so it takes careful and creative storytelling and visual presentation for the data to make sense.
Meanwhile, the great thing about data stories is that they present an opportunity to play around with a number of methods to get the data across. For example, the findings can be packaged as a tweet or a TikTok post, or it can be presented via an infographic or a video. Newsrooms are often employing more than one method to accompany their print or video stories.
Visualizations of the data can help the reporting process and also be an end product.
Finally, get ahead on this process by involving graphics and other teams early. If they are brought in late in the process, it will leave them little time to give the data the visual treatment it deserves.
Other Considerations
Fact-checking
When working with data, allocate time for fact-checking:
- If there have been manual entries into a spreadsheet, plan to check that the entries were done correctly. If the resources are available, ask others uninvolved with the data to check the data entries (you can plan two to three rounds of verification, depending on the complexity of the data.)
- If someone has done an analysis, reproduce the analysis to verify that the same results are obtained. Here, a secondary person to reproduce the analysis and help fact-check is crucial.
- Plan time to check how the results of the analysis are presented in the story and if they are presented in the right context. Also check the visualizations and interactives to make sure they reflect the information and the results of the data analysis.
Keep in mind: Bulletproofing the data helps bulletproof the published story.
Collaborations with Data
Working with data can involve an individual data journalist or a data team. Often working with a dataset may require more than one person depending on the magnitude of data and the resources of the organization.
At the same time, data teams can consist of a mix of skills and have, within the same team, experts in research and data analysis, and also developers. When the data gets complex in scale, structure, and format, bringing an interdisciplinary team can be very powerful and help advance the work.
As a result, investigative projects that involve the use of large datasets can result in team efforts that include reporters, data journalists, researchers, fact-checkers, online producers, editors, and also non-journalists.
For example, engineers can develop tools that help address the needs of the journalists, develop machine learning models to screen millions of records, use technology in the service of journalists, and help process millions of records.
Also, data can be very powerful during international collaborations, as it becomes a connector for journalists from different countries while working together.
Sometimes, however, it’s necessary to get help by collaborating with organizations that have bigger or more experienced data teams. That is why working with organizations like ICIJ, OCCRP, Pulitzer Center or Lighthouse Reports, or partnering with a university with a computer science department may be something journalists or teams want to consider. That’s especially so because these organizations have larger dedicated data teams than most newsrooms, which may just have one or two ‘data people.’
When sharing data with other organizations or even your teammates in-house, make sure you are transparent about where the data was sourced, how it was analyzed, and the limitations of the data.
Finally, when working with interdisciplinary teams, communication between teams is necessary throughout the process, to ensure everyone is on the same page in terms of understanding the goals of the project and how to execute it.
Toolbox
New to data? Here are some courses and tools to consider:
- To master spreadsheets, check out the Basics of Google Sheets by Mark Horvit. Coursera or edX, meanwhile, offer free video courses in Excel, or try this: Let the Sheet Do the Math so You Can Focus on the Story by Brant Houston.
- The Data Journalism Handbook 1 and 2 by the European Journalism Centre.
- Python
- R
- SQL
- Open Refine
- PDF processing tools such as
- Using the command line. You can understand the foundations of the command line from this Missing Semester at MIT material. A colleague, Eric Barrett, has shared this resource with colleagues at OCCRP who were starting to learn the command line.
- Columbia University also makes available a summary of data journalism resources. The Knight Center for Journalism in the Americas, Datajournalism.com, and IRE offer courses and resources that help understand how to use some of the tools and programming languages.
You can also get trained at investigative conferences around the world, including GIJN’s GIJC, Dataharvest, the African Investigative Journalism Conference (AIJC), the Latin American conference COLPIN, ARIJ’s Annual Forum or Nicar by IRE, among others.
Case Studies
Captured — Africa Uncensored
The series explored corruption cases in Kenya connected to “procurement and shady tendering scams in government and government agencies.” The project reviewed public procurement information and explored connections involving public officials and other stakeholders who, through a series of companies, received benefits in tender processes.
Agents of Secrecy — Finance Uncovered, BBC, Seychelles Broadcasting Corporation
This was a collaboration of journalists who used data analysis of publicly available UK companies data and thousands of leaked documents to track down “the masterminds and minions that make up some of the busiest Russia-facing corporate secrecy agencies.” The investigation reviewed the use of anonymous firms in the United Kingdom by money launderers across the former Soviet Union.
Inside the Suspicion Machine — Lighthouse Reports, WIRED, Vers Beton, Open Rotterdam
“For two years, Lighthouse Reports pursued the holy trinity of algorithmic accountability: the training data, the model file, and the code for a system used by a government agency to automate risk assessments for citizens seeking government services.” Once obtained, the team analyzed the risk scoring algorithm and found how it was targeting people based on their native language, gender, and how they dressed.
Pandora Papers – ICIJ and 150 media partners
For nearly two years, reporters dived into more than 11.5 million records in multiple formats linked to 14 different offshore service providers, to write stories that exposed “a shadow financial system that benefits the world’s most rich and powerful,” while naming names. They did this by combining traditional investigative reporting techniques with advanced data analysis. The team used Datashare to process and share the files securely with more than 600 reporters around the world, and used various tools and approaches for the data analysis, including: machine learning, programming languages such as Python, manual data work and graph databases (neo4j and Linkurious).
 Purity Mukami is a statistician turned data journalist. For seven years she has contributed to investigative stories and projects such as FinCENFiles, Pandora Papers, Agent of Secrecy, and Captured among others with her data skills. She has worked at Africa Uncensored, BBC Africa Eye, Finance Uncovered, and now as Africa data journalist at OCCRP She has collaborated with various other organizations investigating corruption, following the money as well as looking out for misinformation during elections.
 Emilia Díaz-Struck is the executive director of the Global Investigative Journalism Network. She was formerly data and research editor and Latin American coordinator at the International Consortium of Investigative Journalists (ICIJ). For over a decade, Díaz-Struck took part in more than 20 ICIJ award-winning investigative collaborations, including: Offshore Leaks, Implant Files, FinCEN Files, Pandora Papers, and the Pulitzer-winning Panama Papers. She pioneered in data journalism and investigative collaborations in her native Venezuela and has been a mentor to hundreds of Latin American reporters. Emilia has taught summer seminars on data journalism and investigative cross-border collaborations at Columbia University in New York. She has been a professor at the Central University of Venezuela and a contributor for the Washington Post, the magazine Poder y Negocios, Venezuelan media El Universal, El Mundo and Armando.info, which she co-founded.


