
Data Journalism Top 10: Shark Attack!, City Cool Spots, Illegal Mines, Extreme Weather, Summer Vacation
Read this article in
Much of the globe is getting hit with heat waves, prompting people to search for ways to stay cool. Bloomberg mapped the cooler spots in some of the hottest cities. Our weekly NodeXL and human curation of the most popular data journalism stories on Twitter also features The New York Times’ investigation into the illegal mining industry in the Brazilian Amazon, BBC and Finance Uncovered’s exposé about sanctioned oligarchs exploiting a transparency loophole in the UK, Carbon Brief’s report on the link between human-caused climate change and extreme weather, and The Wall Street Journal’s look at the frequency of shark attacks around the world.
Locating Cool Spots with Heat Maps
Today’s modern cities are fast becoming urban heat islands, with temperatures significantly warmer than rural areas. But within these sweltering cities, cool spots exist. By analyzing satellite images produced by the European Space Agency, and data from NASA and the US Geological Survey, Bloomberg located several neighborhoods with cooler temperatures within the hot cities of London, Delhi, Fez, Los Angeles, Melbourne, and Seville. These places have certain characteristics that help to reduce their surrounding temperatures: lots of greenery and open space, permanent shade, unpaved roads, rooftops with reflective paint, or they are next to a river, canal, or pond. Also worth a look: Mongabay’s piece on designing homes to stay cool, with a hand-drawn data visualization.
Mapping Illegal Airstrips and Mines
A thriving, illicit mining industry in the Brazilian Amazon is destroying Indigenous lands and threatening biodiversity within the tropical rainforest. The New York Times built a tool to examine thousands of satellite images dating back to 2016 in order to map the presence of illegal airstrips in the region. The paper identified 1,269 unregistered airstrips that were active in the past year, with 61 of them located in Yanomami Indigenous territory.
Sanctioned Oligarchs Exploit Loophole
In 2016, the British government introduced a company beneficial ownership register, forcing almost all UK companies to identify their real owners. However, this transparency measure did not cover English Limited Partnerships (ELP). Since then, more than 4,500 ELPs have been set up. This loophole has become a route for powerful people to dodge anti-money laundering laws and has been exploited by sanctioned Russian oligarchs, according to an analysis by the BBC and Finance Uncovered of leaked documents and thousands of company records.
Human-Linked Extreme Weather Events
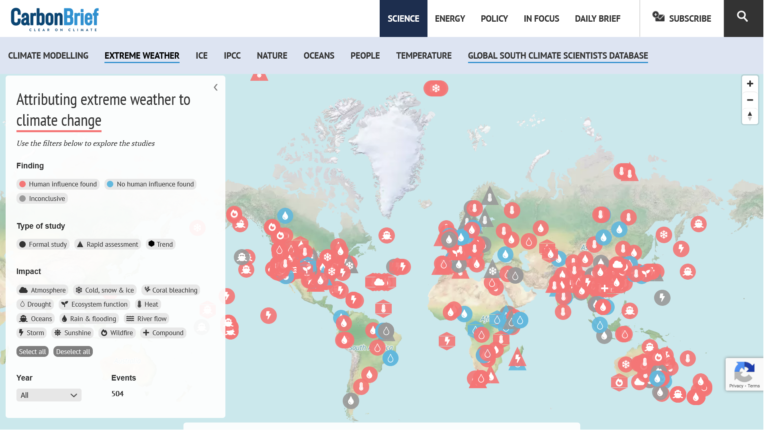
Scientists around the world have been researching extreme weather events such as wildfires, heatwaves, typhoons, and record-breaking rainfalls. Many of these studies point to human activity being a factor in raising the risk of certain types of extreme weather events. Carbon Brief took a look at hundreds of attribution studies and mapped 504 extreme weather events across the globe. It reported that 71% of the events included in the map were made more likely, or more severe, by human-caused climate change.
Insulation: Saving Money and the Environment
According to the Guardian, British houses are some of the worst insulated in Europe. That means it takes more energy, and hence makes it more expensive, to keep them heated during the cold months. The paper walked readers through the potential financial savings and reduction of carbon output they could make if they added or topped up their homes’ insulation for lofts, walls, and windows. Per the Guardian’s calculation: such insulation improvements could reduce one’s annual gas bill by up to £458 ($560) and cut carbon emissions by half, from 2,186kg to 1,051kg.
Mapping Russian Military Radars
By analyzing data obtained from Sentinel satellites, Texty, a Ukrainian data journalism site, first mapped the presence of Russian military radars in occupied territories of Ukraine in mid-April this year. Three months on, journalists wanted to see if there were any changes. They used Bellingcat’s Radar Interference Tracker & 5Ghz Interference Tracker to ‘scan’ the period between May and July, and found that the number of radars present in the country had increased.
Lack of Diversity Among Award Judges
How diverse are the judging panels of the most prestigious journalism awards in the United States? Fellows of the Asian American Journalists Association requested the race and ethnicity of 66 judges who will decide this year’s winners for the Pulitzer Prizes, the Peabody Awards, the Gerald Loeb Awards, and the Livingston Awards. The students found a worrying lack of diversity: the representation of Asian Americans, Blacks, and Latinos on these panels were disproportionate to their respective composition in the US population.
Shark Attacks
A spate of shark attacks off the coast of New York’s Long Island this summer has raised concerns among beachgoers, surfers, and divers. The Wall Street Journal looked into the data to see just how often, or rare, these shark encounters are in the US and across the globe.
Human-Macaque Conflicts
When macaques, a monkey species, appear in news stories in Singapore, the headlines and content tend to skew negatively. They usually mention conflicts with humans — including macaques approaching children, stealing items and food, being aggressive, or attacking. Kontinentalist, a data-driven storytelling studio based in Singapore, examined the complex relationship between humans and macaques in the city-state.
“Visible” Summer Vacation
Using Google’s Mobility Reports data from January 2020 to July 2022, political scientist Anders Sundell examined how much time people were spending at their workplaces in the US, Japan, France, Germany, Italy, and Sweden. He discovered a trend in the European countries: there is a clear dip in numbers in July and August, when Europeans tend to go on vacation. In the US, however, there was no such indication of a visible summer vacation.
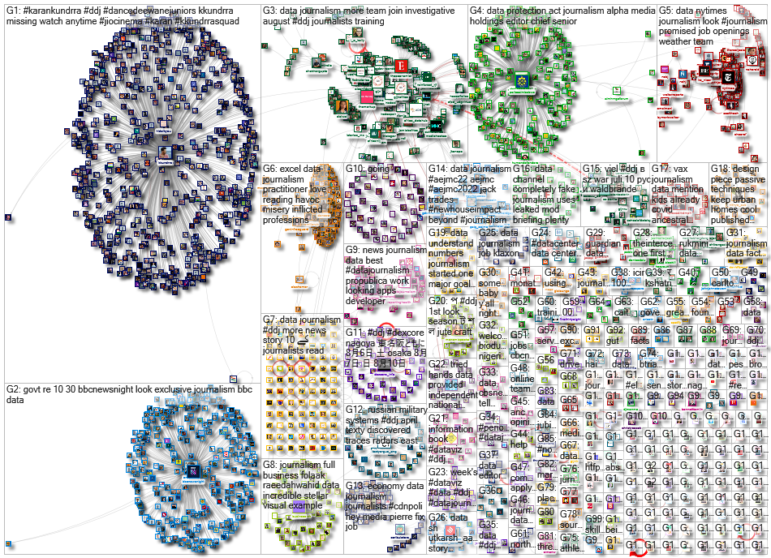
Thanks again to Marc Smith and Harald Meier of Connected Action for gathering the links and graphing them. The Top Ten #ddj list is curated weekly.
 Eunice Au is GIJN’s program manager. Previously, she was a Malaysia correspondent for Singapore’s The Straits Times, and a journalist at Malaysia’s New Straits Times. She has also written for The Sun, Malaysian Today, and Madam Chair.


