Image: Screenshot
Data Journalism Top 10: Rise of Omicron, Africa’s Growing Cities, Tech’s Glass Ceiling, and Honeybees Self-Quarantining
Read this article in
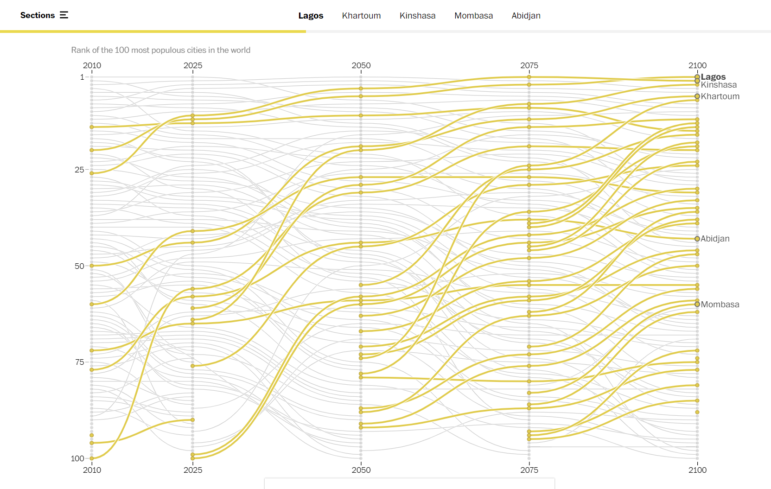
The Washington Post created a visual essay using photography and data to explore the “dozens of African cities that will join the ranks of humanity’s biggest megalopolises between now and 2100.” Image: Screenshot
Omicron, the new coronavirus variant, has made headlines around the world, amid concerns about the efficacy of current vaccines and whether it portends a setback in efforts to combat the pandemic. Our weekly analysis of the most popular data journalism stories on Twitter highlights a story by Spanish newspaper El País analyzing early data on omicron. In this edition, we also feature an investigation into viral fake news and disinformation in Thailand, a data projection on the growth of African mega-cities, and a story on how an artificial intelligence program can judge your music taste.
Gone Viral
In Thailand, news about COVID-19 is some of the most popular content on the internet. But amid the explosion of coronavirus-related material on social media and in traditional outlets, there has been an alarming uptick in disinformation and fake news. An ambitious four-part project by the Bangkok Post digs into the problem and uses data to illustrate how fake news comes in “waves.” The project also discusses the effects of spreading false or misleading information and asks what makes readers click on these headlines.
Tech Funding’s Glass Ceiling
For decades, the tech industry has been dominated by men, resulting in a gender gap both in terms of income and opportunities. The effects of this disparity can be felt in the investment process as female tech entrepreneurs face major challenges when looking to fund their endeavors. The Kontinentalist, an outlet dedicated to telling data stories about Asia, looked at the situation across the region and analyzed data on pitches, investor bias, and who is funding female start-ups.
Rise of Omicron
Omicron has been described as a kind of “Frankenstein” by one Spanish virologist, as a coronavirus variant with more than 50 mutations, particularly on the spike protein, which the virus uses to attach to human cells. It will take time for scientists to study the variant in depth, but the Spanish daily newspaper El País used some early data to show what the omicron virus looks like and to explain how mutations happen.
Changing Patterns in Rainfall and Drought
The weather has become more extreme, causing flash floods, devastating wildfires, and other catastrophes. But the scale of this phenomenon is so enormous many people struggle to comprehend its significance. Numbers help paint a clearer picture. A team of USA TODAY reporters examined 126 years of federal climate data to look for patterns and the reasons behind the changing weather, and then created a tool to look up variation in rainfall and drought based on US zip codes.
Demolishing Historical Landmarks
Every year, at least 150 objects of cultural heritage disappear in Russia. Cities are losing their historical appearance as architectural landmarks and historic buildings are demolished to make space for new buildings. Old towns are suffering the most, according to an investigation by IStories, which looked at data on historical and cultural sites across Russia as well as conservation efforts.
Honeybee Self-Quarantining
If humans want to learn something about fighting a pandemic, they can look to the bees. To prevent parasites from spreading, honeybees avoid each other and segregate behaviors in parts of their hives. The Economist’s graphics team showed the difference between a parasite-free hive and an infected one.
Africa’s Growing Cities
A century from now, most of the world’s 20 biggest urban areas will be concentrated in Africa. A third of the global population will also live in Africa. Five of the most populous African cities — Lagos, Khartoum, Kinshasa, Mombasa, and Abidjan — give an insight into how urban development is transforming the entire continent. The Washington Post visualizes the transformation with this expansive, multimedia data-driven project.
New Pandemic Restrictions
A fourth wave of COVID-19 has forced Austria into a new lockdown and prompted many other European countries to tighten restrictions. This, in turn, has had an immediate impact on businesses such as restaurants, stores, leisure hubs, and the airline industry. The Financial Times examined data from Google’s Mobility Report, Oxford University, and other sources to show how reduced consumer spending has created new challenges for countries in the eurozone.
AI-Powered Journalism
Machine learning offers huge potential. Algorithms are being used in multiple areas including medical diagnosis, image processing, car manufacturing, and banking. Journalism is no exception. Thanks to artificial intelligence, reporters can now analyze massive datasets to empower their storytelling. A piece by DataJournalism.com highlights some examples of this trend.
Your (Bad?) Music Taste
It’s that time of the year again. You can explore your annual Spotify or Apple Music report and find out what you’ve been listening to the most throughout 2021. Meanwhile, The Pudding has created an AI program to judge your taste in music. Go ahead and try it out. Trust me, you’re going to have some fun.
Thanks again to Marc Smith and Harald Meier of Connected Action for gathering the links and graphing them. The Top Ten #ddj list is curated weekly.
 Peter Georgiev is GIJN’s social media and engagement editor. Previously, he was part of NBC News’ investigative unit in New York. He also worked as a correspondent for Bulgarian National Television and his reporting has been published by the Guardian, Deutsche Welle, and other international outlets.
For a look at NodeXL’s mapping on #ddj and data journalism on Twitter, check out this map.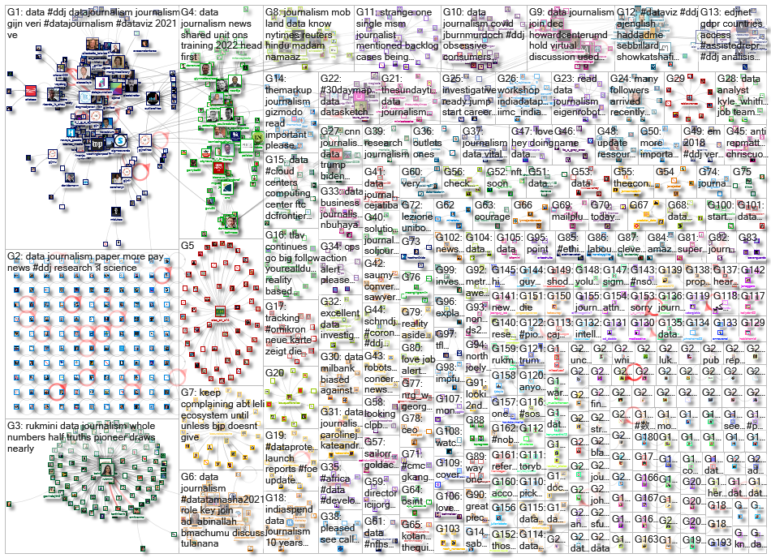

GIJC23 – The Future of Data Journalism: New Analytical Tools, Data Visualization, and AI

GIJC23 – The Basics of Using Google Sheets

GIJC23 – Using Pinpoint to Organize Unstructured Data

GIJC23 – Measuring Impact

How Data Journalism Is Changing the Face of Africa

Trump’s Disappearing Donors, Tracking the Mars Rover, and the Ongoing Wars in Gaza and Ukraine
Airplane Accidents, 2024 Elections, Europe’s Lost Snowfall, and Recycling Movies

Data-Driven Journalism: Roundup of Recent Standout Stories

This work is licensed under a Creative Commons Attribution-NoDerivatives 4.0 International License
Republish our articles for free, online or in print, under a Creative Commons license.
Republish this article
This work is licensed under a Creative Commons Attribution-NoDerivatives 4.0 International License
Read Next
Africa Focus Data Journalism
How Data Journalism Is Changing the Face of Africa
Data journalism in Africa has made a powerful impact, from holding leaders accountable to refuting myths around domestic violence. But the field faces formidable challenges.
Data Journalism Data Journalism Top 10
Trump’s Disappearing Donors, Tracking the Mars Rover, and the Ongoing Wars in Gaza and Ukraine
Our column of the best in data journalism also features stories on AI’s ability to forecast the weather, analyzing the Argentine president’s Tweetstorms, and apathetic EU voters.
Data Journalism Data Journalism Top 10
Airplane Accidents, 2024 Elections, Europe’s Lost Snowfall, and Recycling Movies
With pieces on the global campaign landscape, airplane accidents, European snowfall, and the toll of the ongoing Israel-Hamas conflict in Gaza.
Case Studies Data Journalism GIJC23
Data-Driven Journalism: Roundup of Recent Standout Stories
The best of modern data journalism tells powerful stories that test assumptions. At GIJC23, two experts discussed strong recent investigations and what makes them stand out.