
Data Journalism Top 10: Measuring Mask Use, Parental Interruptions, Childbirth Woes, India’s Low Death Rate
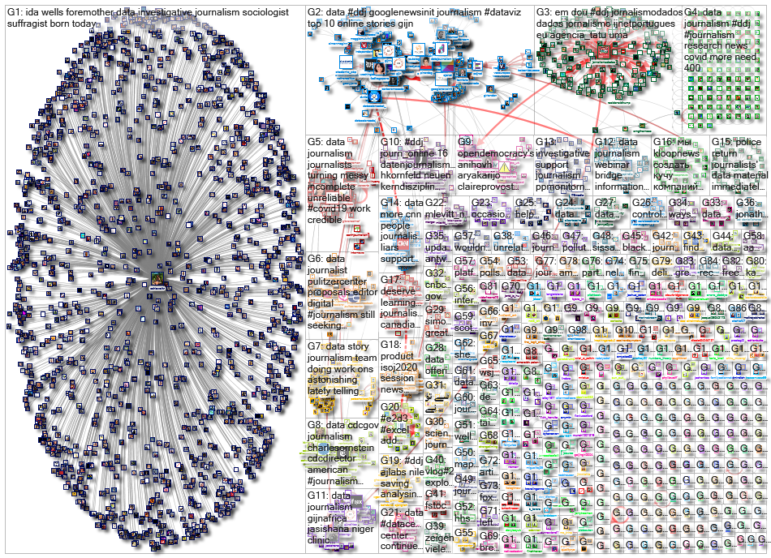
How widespread is mask use in your country? Our NodeXL #ddj mapping from July 13 to 19 finds The New York Times mapping the odds of people encountering other mask wearers in the United States, two university professors quantifying the number of interruptions a parent suffers working from home, the Committee to Protect Journalists talking to data journalists about the struggles of reporting on COVID-19, and openDemocracy documenting mistreatment of women in labor since the pandemic began.
Mask Use in the United States
Do people in your area wear masks when they are outside? The New York Times mapped the odds — if you encountered five people in a given area in the US — that all of them would be wearing masks. The data is from 250,000 responses collected between July 2 to 14, and comes from a survey conducted by the global data firm Dynata at the request of the NYT.
Measuring Interruptions While Working From Home
During the pandemic, many parents have had to adapt to the realities of working from home while parenting, and it hasn’t been easy. Profs. Suzanne M. Edwards and Larry Snyder got so frustrated by all the interruptions to their professional work that they quantified it. The disruptions they counted included their children’s requests for help with homework, questions about chores and snacks, check-in hugs, and tech support. They found that on average, a parent on childcare duty was interrupted 15 times per hour.
Data Challenges of Covering COVID-19
From insufficient data to governments deliberately restricting access to information, covering the coronavirus pandemic has been a challenge, data journalists told the Committee to Protect Journalists. Five journalists — Darren Long, Rodrigo Menegat, Mariano Zafra, Allison McCann, and Denise Hassanzade Ajiri — shared how they had used creativity, collaboration, and hidden sources to illuminate COVID-19’s impact.
Childbirth Rights During the Pandemic
OpenDemocracy has been documenting cases of abuse and mistreatment of women in birth labor around the world since the pandemic started. Their map displays cases in at least 45 countries so far. They welcome help to add to their findings, and are also offering a webinar today (Thursday July 23) to discuss what they’ve uncovered with their forensic work into women being denied essential services or being treated in ways that breach the World Health Organization’s guidance.
US Data on COVID-19
The Brown Institute for Media Innovation, a collaboration between Stanford University’s School of Engineering and Columbia Journalism School, launched Documenting COVID-19, a repository of searchable local, state, and federal documents in the US related to the pandemic. The data is obtained through state open-records laws and the federal Freedom of Information Act.
India’s Low Coronavirus Death Count
India’s confirmed coronavirus toll has surpassed one million cases, joining a “club” that now comprises the US and Brazil. However, India’s death rates from the virus are mysteriously low compared to the other two nations. The Washington Post examines theories and factors that may have contributed to the low death rate.
Trump Profiting from Public Service
Karen Tumulty, a columnist who writes about national politics for The Washington Post, wrote an Op-Ed about how Donald Trump’s private businesses are profiting from his public service. According to the Center for Responsive Politics, Trump’s presidential campaign and its related committees have steered US$2.6 million of donors’ money to Trump’s family-owned properties and businesses.
Mapping Istanbul’s Health Services
Eren Janberk Genç, a student at Boğaziçi University, examined the distribution of healthcare services across Turkey’s largest city, Istanbul, in an attempt to find patterns and possible inequalities in the city’s health services.
https://twitter.com/ejgenc/status/1282740193288769536
German Parliament Scraper
Looking for German parliamentary data and a quick way to scrape it from online? Data journalist Katharina Brunner shared a scraper, written in Python, for Parlamentsspiegel, a site that collects the federal parliamentary documentation of Germany.
Data Visualization Workshop
5W Consulting, an information design company, is offering a four-day information graphics and data visualization workshop online in September. The instructors include the 5W founders Juan Velasco, previously the art director for National Geographic, and Samuel Velasco, former art director at Fortune magazine. The early bird price is US$500.
Thanks again to Marc Smith of Connected Action for gathering the links and graphing them. The Top Ten #ddj list is curated weekly.
 Eunice Au is GIJN’s program coordinator. Previously, she was a Malaysia correspondent for Singapore’s The Straits Times, and a journalist at the New Straits Times. She has also written for The Sun, Malaysian Today, and Madam Chair.
For a look at NodeXL’s mapping on #ddj and data journalism on Twitter, check out this map.

No Coding Required: A Step-by-Step Guide to Scraping Websites With Data Miner

Free, Game-Changing Data Extraction Tools that Require No Coding Skills

Basic Data Journalism Tips for Editors

My Favorite Tools: Venezuela’s Lisseth Boon on Design and Data Visualization

How a WhatsApp Community Is Bringing India’s Data Storytellers Together

Turning the Threat to a Distant Glacier into a Local Story Through Data Visualization

Mexico Scrapped Its Transparency Agency — Journalists Are Still Investigating Corruption

Making Trillions Make Sense: How Reuters Visualized the AI Economy

This work is licensed under a Creative Commons Attribution-NoDerivatives 4.0 International License
Republish our articles for free, online or in print, under a Creative Commons license.
Republish this article
This work is licensed under a Creative Commons Attribution-NoDerivatives 4.0 International License
Read Next
Data Journalism
How a WhatsApp Community Is Bringing India’s Data Storytellers Together
Recently, more than 400 people gathered in the Indian city of Bengaluru for VizChitra 2026, a conference on data visualization and storytelling — but that is only a small part of the story.
Climate Data Journalism
Turning the Threat to a Distant Glacier into a Local Story Through Data Visualization
New York Times climate and environmental graphics reporter Mira Rojanasakul discusses how her team visualized the sea level rise threat from the melting Thwaites Glacier in Antarctica.
Data Journalism
Mexico Scrapped Its Transparency Agency — Journalists Are Still Investigating Corruption
A year after Mexico dissolved the autonomous body that oversaw government transparency, journalists are still finding ways to access public documents and conduct data-based investigations.
Data Journalism
Making Trillions Make Sense: How Reuters Visualized the AI Economy
How do you make a trillion dollars feel real to someone who has never seen that much money? Vineet Khare and Mayank Bhatt faced that very challenge for their data-driven investigation into AI investment.