
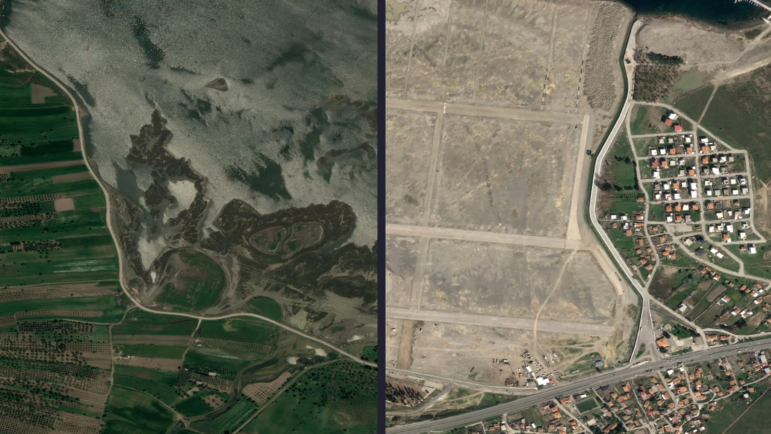
The images show what was once a vital stop for migratory birds along Turkey’s Aegean coast, now buried beneath more than one square kilometre of concrete – foundations for a facility that will repair and build luxury yachts. Image: Green to Grey
Earlier this year, the Global Investigative Journalism Network organized an online training program on investigative climate journalism with the Knight Center for Journalism in the Americas. Touching on everything from fossil fuels and food production to health issues and corporate pledges, the course covered dozens of the world’s best climate investigations.
Here, we bring you behind the scenes for four of these investigations — projects that developed innovative data journalism methods, persisted in classic paper-trail journalism, and spoke with affected communities across the world to get the full story. Collectively, they show that climate journalism is best when technical wizardry is combined with on-the-ground conversations and interviews with experts.
Scrutinizing Government Reforestation Goals
Davao Today Executive Director Lucelle Bonzo had long heard the rumors: that the Philippines’ massive and expensive National Greening Program (NGP), the country’s flagship reforestation program, was full of problems.
There were anecdotal media and civil society reports flagging issues in locations across the country, but no one had been able to show the problem at scale. Working through an Earth Journalism Network fellowship with Eva Constantaras, data editor at Lighthouse Reports, and the outlet’s data scientist Lu Min Lwin, Bonzo examined how the program developed over two million hectares. In May 2025, they co-published their years-long investigation, showing that the program often fails at both reforestation and empowerment of rural communities, its two main aims.
To reach this conclusion, they employed a mix of satellite analysis and on-the-ground reporting that married data crunching with local expertise.
Bonzo found a dataset of over 130,000 sites across the country that were part of the NGP. Crucially, they contained the geographical boundaries of each site, which meant they could lay them all on a map, and other information such as the year they received the NGP designation, who owned or leased the land, and what commodities or forest cover was present.
They then retrieved forest loss data (with each pixel representing a 30 x 30 meter real world area) from the University of Maryland’s Global Forest Change project and discounted losses due to fire using a separate dataset. Using Google Earth Engine, they overlaid the boundaries of each site against the forest loss data, and found that one in 25 hectares suffered a major deforestation event.
With national data available, the team identified two areas that had experienced significant forest loss during the period they studied. Bonzo then went on to report there, working closely with local community groups and activists.
“The ground reporting and the data analysis speaking to each other was really crucial,” says Constantaras, who adds that they got tips about why some areas were losing forest — local corruption, for instance — that they might have overlooked by just looking at the forest loss data.
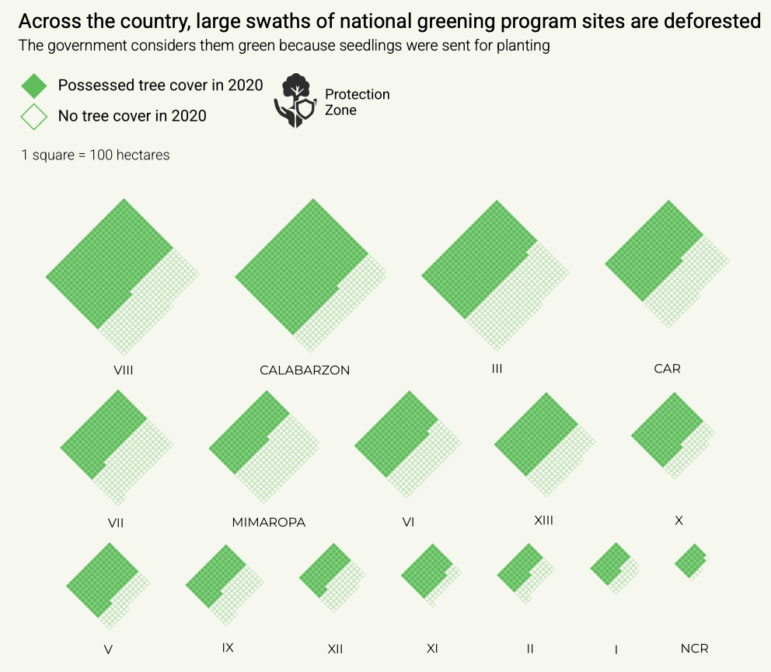
Davao Today found that the Philippine government’s National Greening Program had failed to stop deforestation across the country. Image: Screenshot, Davao Today
It also allowed them to focus the reporting and protect the team in a country where environmental journalists face threats. “You don’t want to just rock up to some of these sites and start asking around either,” she explains. “We could figure out a whole lot before we actually had to put a reporter at risk on the ground.”
With this on-the-ground reporting, they also concluded that a major issue was land tenure and decisions around crops. Many sites only had leases for three years, or focused only on a single (and possibly volatile) commodity; and only a small fraction of locations had solid 25-year agreements.
The country’s Forest Management Bureau told the reporters that complaints must be reported to them with evidence so they can conduct a thorough investigation. It acknowledged that some areas were cleared, but only in preparation for reforestation. The team wrote in the piece that this is “not the type of forest loss captured by our analysis.”
The Lighthouse Reports team is now thinking about expanding the work. “We’ve graduated to looking at oil palm data, we’ve played around with some experimental detection of cacao, detection of rubber,” says Lwin. “Wherever you have the cookie cutter [the shapefiles] and the cookie dough [land use data] situation, you can apply this kind of analysis.”
When Green Turns Grey
In 2024, Turkish investigative journalist Zeynep Sentek read a story by the Norwegian public broadcasting NRK, which showed how much nature had been lost to roads, buildings, and other developments. “I thought, ‘this is beyond cool,’” she recalls. “We should do this Europe-wide.”
Within a few months, her team at Arena for Journalism in Europe had enlisted NRK to participate and convened 41 journalists and scientists from 11 countries into a continent-wide project. In October 2025, the Green to Grey investigation was published, showing that every year Europe loses 1,500 square kilometers (579 square miles) of nature and croplands to construction, a rate of 600 football pitches every single day. Their work earned a Sigma Award in 2026.
The first step was finding data. They used Dynamic World, a land use dataset that analyzes satellite data and is trained to detect what kind of land-use is present in each pixel: built-up, water, trees, grass, and other similar classes.
“We found all of the pixels that, over a certain period, went from being classified as nature to being classified as not nature,” explains Léopold Salzenstein, data coordinator for the project.
The database was very precise: each pixel represented a 10 x 10 meter area. In total, they processed close to 185,000 Sentinel-2 satellite images and analyzed 84 billion pixels, from 2018 to 2023. Each one had been classified by the model, but that was not enough.
“We knew that there was some uncertainty and that the model would be wrong sometimes, and we had to verify it,” Salzenstein notes.
First, they manually checked 1,000 sites across the continent to fine-tune the precision of the model. Then, they assembled a team of 40 journalists and fact checkers and collectively reviewed an additional 9,000 individual pixels randomly selected across the continent, in a process that took over 500 hours.
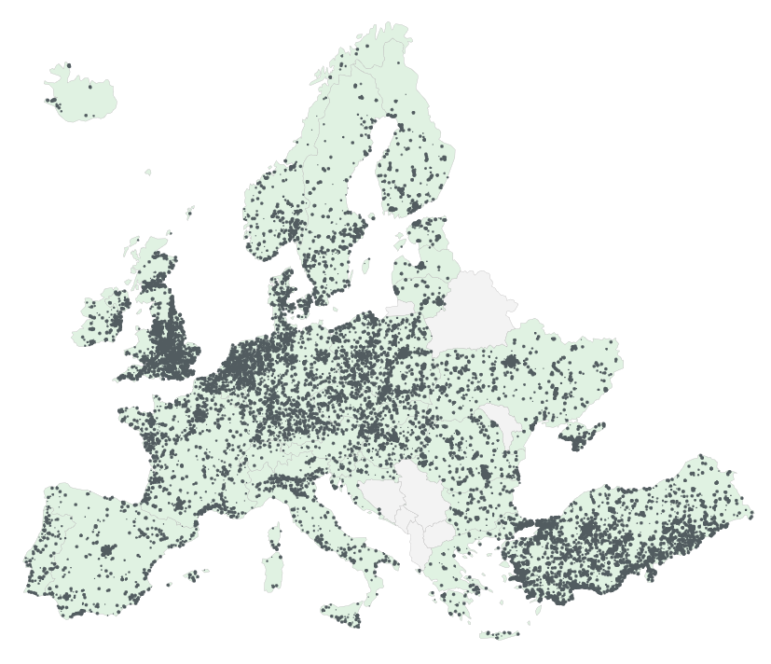
Random sample of constructions projects larger than 10,000m² identified by the Green to Grey team’s methodology. Image: Screenshot, Green to Grey
Each reviewer logged into an app developed by scientists supporting the project saw an enlarged version of a pixel and was asked to determine whether they had gone from nature to construction, often double-checking against high-resolution images from Google Earth, Planet Labs, or ESRI Way Back. Classifications that were still unclear — as well as those where reviewers disagreed with the model — were double-checked by the coordinating team. This calibration process allowed the team to determine where the model was under- and over-estimating nature loss.
While this verification was ongoing, journalistic teams in 11 countries were reporting on the ground.
Their stories show the breadth of the issue. Overall, their reporting found natural and green spaces were rapidly disappearing across the continent. More specific examples included a Turkish haven for migratory birds that was replaced with a facility to build and repair luxury yachts, the tourism development on Lake Garda and wind farm projects in Greece. The team at Arena for Journalism is now working with more partners and investigations, to extend the collaboration.
Who Bears the Bigger Burden of Global Warming?
A few years ago, climate reporters Sofia Moutinho and Elisabeth Gawthrop had a question: was extreme heat’s massive impact on health slipping under the radar of policymakers in the US? Working as part of the series Hidden Epidemics, by Columbia Journalism Investigates, they set out to find out.
Gawthrop had previously secured access to data from the Healthcare Cost and Utilization Project (HCUP), the largest collection of hospital care data in the country. After months of analyzing the data and conducting dozens of interviews, they published a special report showing a surge in heat-related illnesses in Arizona and Florida, two of the fastest-warming states in the US, that disproportionately impacted poorer communities. It was a case study of accountability journalism, revealing a trend that was hurting people across the country but going unnoticed.
The HCUP is a detailed and sensitive database: it aggregates billions of hospital visits and includes information such as ZIP code, diagnosis, demographics, and admission information. It’s usually employed by research professionals, not journalists. After purchasing access, Gawthrop had to take a certification course to access it securely, but it paid off: never before had a media outlet looked at heat-health impacts and linked illnesses like heat stroke, heat exhaustion, and dehydration this deeply.
With the database in hand, the next question was where to look and when. After looking at which states were warming faster, they focused on Arizona and Florida, second and third on that list (the first, California, had fewer people living in the warmest areas).
They worked with health specialists to identify the diagnosis codes that revealed heat exposure, and which to exclude, and aggregated the data by ZIP code. They focused on the top two – Lincoln Park in Phoenix, Arizona, which had a per-capita heat-related hospitalization rate 10 times higher than the state average, and Fort Pierce in Florida, 120 miles north of Miami, with a rate nearly six times the average.
Working remotely, the team called dozens of local organizations, fire departments, and health facilities to get a better understanding of the data.
“Heat-related illness is not something like a chronic disease where you might find a support group of victims,” explains Moutinho, who led on the reporting. “And a lesson from this case was to cast a wide network, to talk to as many people as you can.”
Moutinho’s reporting showed an economic and race element in these two areas, and also uncovered a prevalence of other pre-existing conditions like diabetes and hypertension. The pair went back to the hospitalization data to find these other ailments and filtered the dataset by income and race. Suddenly, the trends made more sense.
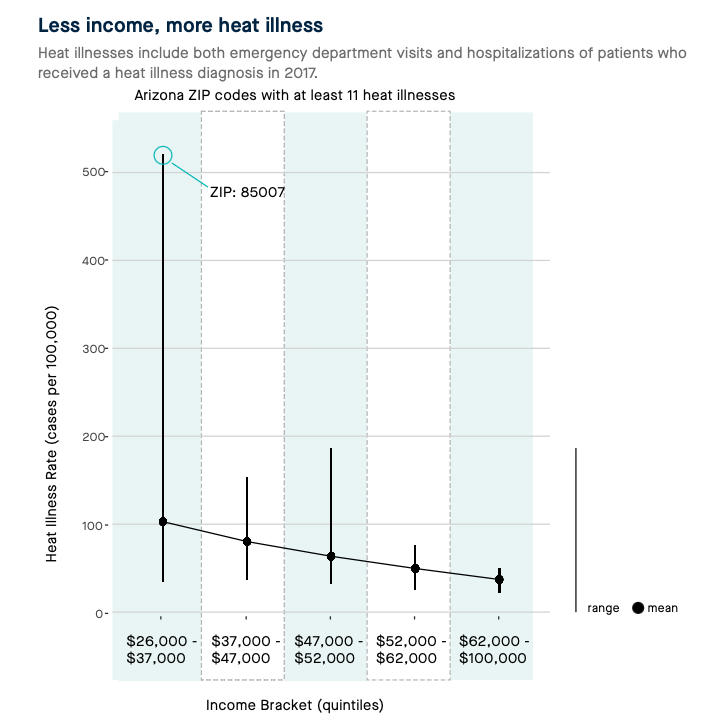
This Columbia Journalism Investigations piece tracked the unequal impact of heat-related illnesses in communities in Arizona and Florida, based on income levels. Image: Screenshot, Center for Public Integrity
“It’s fascinating because… the numbers themselves didn’t tell you the story,” says Moutinho. “You had to go and dig deeper to find the meaning of the story by talking to sources.”
They secured separate datasets that could verify their findings — including official state health department numbers and 911 call records — and shared the data with local news organizations, including the Orlando Sentinel and Arizona Republic.
Their final story combined data analysis with the voices of local residents who were struggling with the heat and experts who gave context to their findings. It also showed how some of the heat-related trends were partly driven by historic redlining, where poor and minority residents were systematically walled off into resource-starved communities and prohibited from moving into wealthier neighborhoods. For many policymakers, says Moutinho, it was the first time this invisible link between heat and race and economic demographics was made visible.
Chile’s Tailor-Made Regulations
Francisco Parra is an experienced climate journalist, but one of his latest investigations started outside the profession. He was taking a graduate program and had to analyze a decarbonization-related regulation as part of his coursework. He chose Chile’s framework to limit air pollution from coal plants, which in 2025 was wrapping up a five-year process to update its standards.
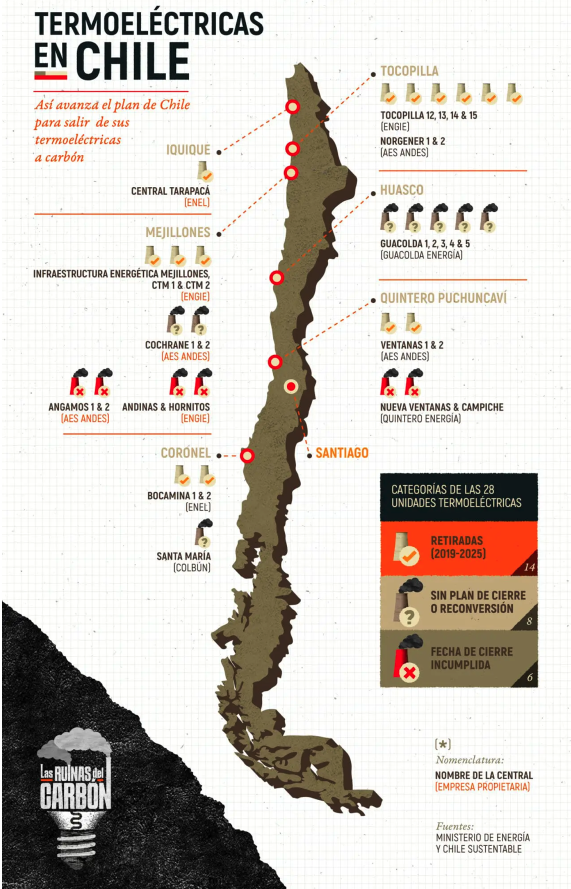
Image: Screenshot, EL CLIP; illustration by Gastón González
Looking into the regulations, he learned that civil society organizations were calling out a technical detail. Chile’s coal plants had to limit their emissions, but the decree included a notable loophole. A transitory provision allowed those power plants with a “reconversion plan” to release up to nearly twice as much as others. There was only one such technology that fit that bill, a coal-ammonia mix, and only one facility, the 760 MW Guacolda plant, had such a plan.
Working with colleague Paula Díaz Levi, the team published an exposé in 2025 showing how this regulation’s exception was “tailor-made” for this plant, and their documents demonstrated that it wasn’t aligned with the country’s climate plans. Their investigation was part of a regional collaboration Las Ruinas del Carbón, about coal power in Latin America.
To reach that point, Parra and Díaz Levi followed the document trail. They read the regulatory case file for the framework process, which includes meeting minutes, company submissions, and external reviews, manually reviewing hundreds of pages. They talked with experts and sources and developed an understanding of how this regulation worked.
“The mix of combining different sources, from the paper trial to people, including interviews on [the record] and many off [the record] were crucial for the investigations,” said Díaz Levi.
They found the exact point in time that the regulations were loosened, and a mention of that fact in the minutes by a civil society expert. And then they kept digging into the company’s own feasibility study for the “reconversion plan.” In it, the company admitted that the plan would only be viable if the facility’s operating life was extended to 2050. “This showed us that the company intended to operate beyond Chile’s deadline to close coal power plants, which is 2040,” Parra noted.
Parra and Díaz Levi reached out to the company on multiple occasions; the company declined to comment on the reporting.
The team also found — working with colleagues from Reportea.cl — that the key Ministry of Energy official who had been shepherding this coal plant regulation process changed jobs within months of the framework receiving internal approval. His next position? Working for the industry trade group that promotes Chile’s power plants.
 Diego Arguedas Ortiz is a journalist, editor and media trainer specialised in climate change. From 2022 to 2025, Ortiz served as the Associate Director at the Oxford Climate Journalism Network at the Reuters Institute for the Study of Journalism, Oxford University. He supported over 800 editors and journalists from over 120 countries to improve the quality and impact of their climate journalism. He has worked extensively training journalists globally and with a focus on Latin America, including work with the Central American Journalists Network, the Festival GABO and the Inter American Development Bank. As a reporter, he has covered climate change since 2013 and his work has appeared in BBC Future, MIT Technology Review and The Observer, among other outlets. His work includes six UN Climate Conferences, the Panama Papers international collaboration in 2016 and on-the-ground reporting from a dozen countries. In 2015, he was the founder of Ojo al Clima, Central America’s first climate outlet.

Climate Journalism: Free Online Course on Investigative Reporting for Every Beat

Guide to Investigating Fossil Fuels: Greenwashing

Database for Carbon Offset Reporting

Guide to Investigating Fossil Fuels: Government Regulations and Policies
Tips to Investigate Climate Change Impacts in an Era of Science Denialism
Climate Change Reporting and Mental Health: Practical Tips for Newsrooms and Journalists
Climate Change: Holding Government and Industry Accountable

Fossil Fuel Investigations: How to Find Stories Using Oil and Gas Supply Chains

This work is licensed under a Creative Commons Attribution-NoDerivatives 4.0 International License
Republish our articles for free, online or in print, under a Creative Commons license.
Republish this article
This work is licensed under a Creative Commons Attribution-NoDerivatives 4.0 International License
Read Next
Reporting Tools & Tips
Tips to Investigate Climate Change Impacts in an Era of Science Denialism
As oligarchs and populist governments ratchet back the gathering and dissemination of climate-related information, journalists can use these techniques to find relevant sources and track impact.
Research
Climate Change Reporting and Mental Health: Practical Tips for Newsrooms and Journalists
In a recent Reuters Institute webinar, experts discussed the latest research into the impact of climate reporting on journalists’ mental health.
GIJC23 News & Analysis
Climate Change: Holding Government and Industry Accountable
As climate change impacts communities across the globe in the form of wildfires, record heat, deadly flooding, and devastating droughts, there is a growing urgency in investigating the causes and impacts.
Climate Reporting Tools & Tips
Fossil Fuel Investigations: How to Find Stories Using Oil and Gas Supply Chains
The oil and gas industry is complex and notoriously opaque. But with new tools, it’s become easier for investigators to dig into this field.