Data Journalism
This Week’s Top 10 in Data Journalism
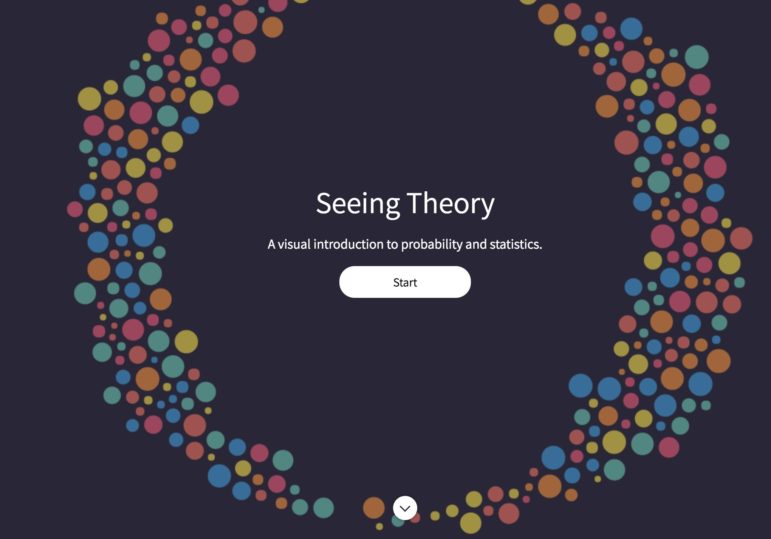
What’s the global data journalism community tweeting about this week? Our NodeXL #ddj mapping from March 12 to 18 finds disturbing news from @NASAEarth about low Arctic sea ice and temperature anomalies in the North Pole, @seeingtheory ‘s redesigned educational website on probability and statistics and top ten ways to clean your data by @Microsoft.