Data Journalism
America’s Cultural Landscape, Germany’s Record Summer, Spain’s Immigration Boom, Google’s Data Search
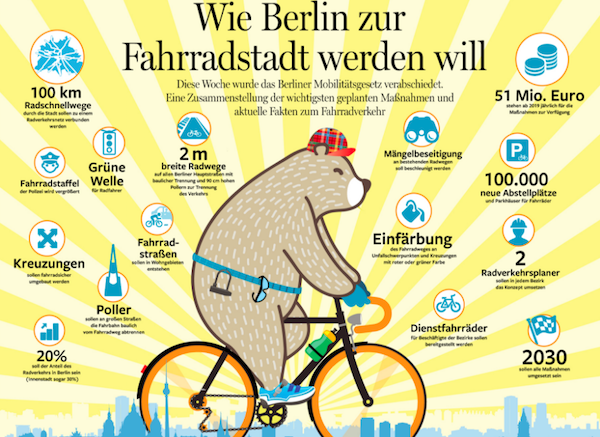
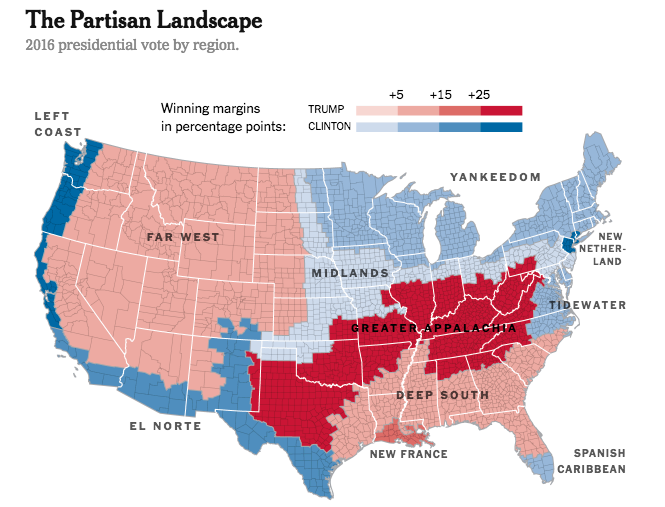
What’s the global data journalism community tweeting about this week? Our NodeXL #ddj mapping from July 30 to Aug 5 finds practical advice from @junkcharts for conference presenters to showcase their graphics, @Google making data in data journalism pieces more searchable, @funkeinteraktiv displaying the ways Germany is breaking records this summer, @eldiarioes examining Spain’s immigration boom and author Colin Woodard breaking down America’s regional cultures in The New York Times.