
GIJN’s Data Journalism Top 10: Footballers’ Salaries, Google Trends and Gender Bias with Pudding
What’s the global data journalism community tweeting about this week? Our NodeXL #ddj mapping from July 9 to 15 finds @morgenpost’s interactive slider showing how fast a German national footballer earns your monthly salary, tons of interesting Google search data in its @GoogleTrends data store, @durand101 and @puddingvizgender exposing bias in the UK House of Commons and @EdjNet offering a search engine for 800,000 EU datasets.
Compare Your Salary to German Footballers
How fast can the German national football players earn your monthly salary? Use the slider Berliner Morgenpost created to find out. Toni Kroos, Mesut Ozil, Thomas Müller and Manuel Neuer can earn 3200€ in less than 2 hours on the field.
Excellent gamified data story here – “How long does it take the German national team to get your own monthly salary?” #ddj #dataviz https://t.co/UO1vJb19sN via @morgenpost
— Richie Lionell (@richielionell) July 12, 2018
Google Trends Galore
Find global search interests for World Cup matches, restaurants, Star Wars, hate crimes and Taylor Swift versus Ed Sheeran versus Korean boyband BTS during the Billboard Music Awards and more in the Google Trends data store. Download and play with key datasets curated by the News Lab at Google team.
All our #datajournalism is open source and we publish the raw data on @github https://t.co/j8BLcUrxAF#OpenData #DDJ pic.twitter.com/f7mh3esk2M
— Simon Rogers (@smfrogers) July 11, 2018
Gender Bias
This year marks a century since some women in the United Kingdom were awarded the right to vote in and stand for elections. Pudding looks at the gender parity in the House of Commons and the time spent by both genders on different topics. Women spent more time discussing welfare reforms, childcare and social care, while men talked more about energy, legislation and the armed forces.
Fascinating analysis exploring the last 100 years of #women in parliament using #machinelearning by @durand101 @puddingviz – definitely worth a read https://t.co/FsNWYL4uhi pic.twitter.com/4nShAnf5vw
— Rose Acton (@RoseActon) July 13, 2018
European Data Search Engine
The European Data Journalism Network launched a data search engine to help journalists trawl through more than 800,000 datasets collected by the European Data Portal and the EU Open Data Portal. The tool is developed and maintained by Osservatorio Balcani Caucaso Transeuropa and suggestions to improve it are welcomed.
Looking for #opendata on issues affecting Europe? Our Data Search Engine now provides easy access to them https://t.co/YflV5PK19U pic.twitter.com/kLSaP1hE3M
— European Data Journalism Network (@EdjNet) July 12, 2018
Conversations on Open Data
Data Driven Journalism’s 5th edition of its Conversations with Data newsletter focuses on open data. Nikesh Balami, Natalia Carfi, Paul Bradshaw, Eva Constantaras, and others offer advice and experience in working with open data.
“Start with the data you have, not the data you would like to have” – advice from @EvaConstantaras in our #opendata edition of Conversations with data. Also featuring @paulbradshaw, @humdata, @opendatacharter, and more: https://t.co/r21YNttXP4 #ddj #datajournalism pic.twitter.com/ihdx163nmV
— DataDrivenJournalism (@ddjournalism) July 11, 2018
From Data to Viz
A decision tree from Data to Viz helps you pick the right graph to visualize your data based on your input. The tree leads to 20 visualization formats representing the most common dataset types.
For dataviz lovers https://t.co/J5DXhnQbc7
— Aysun Akarsu (@aysunakarsu) July 16, 2018
Call for Data-Driven News Production
The European Commission launched a second call for proposals in the field of data-driven news production. Applicants are invited to submit proposals to increase reporting on European issues from pan-European viewpoints and/or by comparing different viewpoints from within Europe, using data-driven techniques. Deadline is September 17, 2018.
Appel à candidatures: vous êtes data journaliste et souhaitez vous associer avec d’autres data journalistes européens pour monter un projet transnational? Cette bourse est faite pour vous: https://t.co/q1sDJeTyRa Deadline: 17 septembre . #ddj #bourse pic.twitter.com/trtJXvC2gU
— GIJN en français (@gijnFr) July 10, 2018
Data Tipsheets (Arabic & English)
The first Arab Data Journalism Conference was held this year from March 6 to 8 in Egypt. Here are 16 tipsheets from the conference, covering tips on using data in breaking news to producing data-driven sports stories.
Statistical Data Analysis Tool (Turkish)
inZight is a free, easy to use software for statistical data analysis which was initially designed for New Zealand high school students. Data Journalism in Turkey wrote a short tutorial on the software.
?R destekli açık kaynak görselleştirme aracı: iNZighthttps://t.co/lai225gunB #verigörselleştirme #araç #ddj #vg #dataviz #verihaberciliği #açıkkaynak #tool #rstats #datajournalism pic.twitter.com/8CrXxlHWvh
— Veri Gazeteciliği Platformu (@DagmedyaVeri) July 10, 2018
Flourish DataViz Tool
Digital journalist Bernd Oswald breaks down some benefits and features of Flourish, a data visualization tool, and highly recommends it for data journalists.
Was kann Flourish? @berndoswald stellt das Tool bei @ojour_de vor. #ddj #dataviz #datenjournalismus https://t.co/KOCwuuiJIf
— Fiete Stegers (@fiete_stegers) July 13, 2018
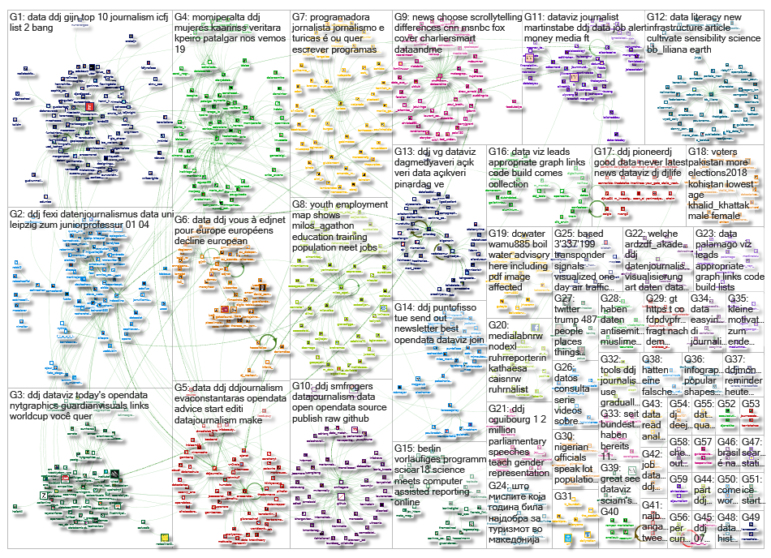
Thanks, once again, to Marc Smith of Connected Action for gathering the links and graphing them.
 Eunice Au is GIJN’s program coordinator. Previously, she was a Malaysia correspondent for Singapore’s The Straits Times, and a journalist at the New Straits Times. She has also written for The Sun, Malaysian Today and Madam Chair.
For a look at Marc Smith’s mapping on #ddj on Twitter, check out this map.

Basic Data Journalism Tips for Editors

My Favorite Tools: Venezuela’s Lisseth Boon on Design and Data Visualization

Document of the Day: Visual Vocabulary

A Call for Debate: Taking Open Data and Government to the Next Level

How a WhatsApp Community Is Bringing India’s Data Storytellers Together

Turning the Threat to a Distant Glacier into a Local Story Through Data Visualization

Making Trillions Make Sense: How Reuters Visualized the AI Economy

Summer Reading List for Data Journalists: For Those Who Believe in the Power of Storytelling with Numbers

This work is licensed under a Creative Commons Attribution-NoDerivatives 4.0 International License
Republish our articles for free, online or in print, under a Creative Commons license.
Republish this article
This work is licensed under a Creative Commons Attribution-NoDerivatives 4.0 International License
Read Next
Data Journalism
How a WhatsApp Community Is Bringing India’s Data Storytellers Together
Recently, more than 400 people gathered in the Indian city of Bengaluru for VizChitra 2026, a conference on data visualization and storytelling — but that is only a small part of the story.
Climate Data Journalism
Turning the Threat to a Distant Glacier into a Local Story Through Data Visualization
New York Times climate and environmental graphics reporter Mira Rojanasakul discusses how her team visualized the sea level rise threat from the melting Thwaites Glacier in Antarctica.
Data Journalism
Making Trillions Make Sense: How Reuters Visualized the AI Economy
How do you make a trillion dollars feel real to someone who has never seen that much money? Vineet Khare and Mayank Bhatt faced that very challenge for their data-driven investigation into AI investment.
Data Journalism
Summer Reading List for Data Journalists: For Those Who Believe in the Power of Storytelling with Numbers
Featuring books spanning four continents, these recommended reads provide a global perspective on data journalism.