
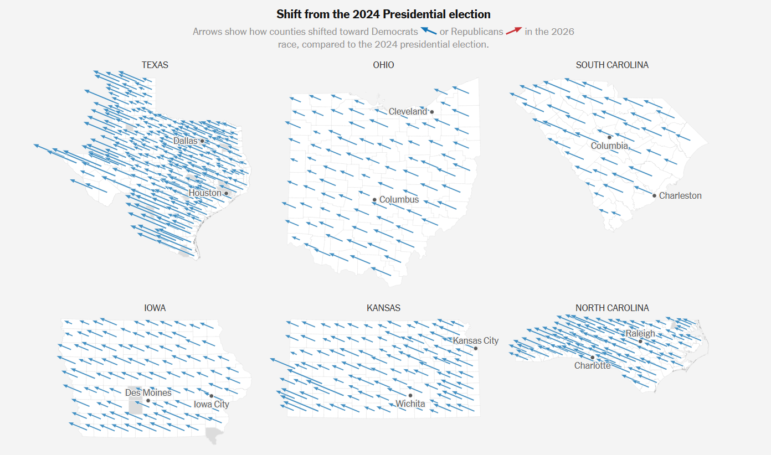
A sea of blue showing how voters in the United States swung towards the Democrats. Image: Screenshot, The New York Times
‘Blue Tsunami’ Sweeps US Midterms, Ongoing Displacement in Lebanon, Mapping European Protests

How Many Journalists Does It Take to Fill an Olympic Swimming Pool? GIJN’s Guide to Size and Number Comparisons

Investigative Journalism Week 2026 Resources

International Research Guide: How to Find Experts and Hidden Documents on Any Topic

Guide to Investigating Tech and AI in Modern Warfare
Democrats swept to victory in the US midterm elections on November 3, winning both the House of Representatives and the Senate and flipping Republican strongholds such as Texas and Kansas. In a vote widely considered a referendum on President Donald Trump’s second term, The New York Times showed how county-level votes shifted toward Democrats compared to the 2024 presidential election. Our roundup of the Top 10 in Data Journalism, looking at stories from October 22 to November 4, also includes the Guardian’s breakdown of Elon Musk’s record political spending in the lead-up to the midterms, Bloomberg’s granular look into the items contributing to inflation as voters headed to the polls, an El País analysis of the student protests and cost-of-living demonstrations sweeping Europe, and Lebanon-based news site Raseef22 investigated why hundreds of thousands of people displaced from wars with Israel in southern Lebanon still can’t return home.
Which US States Flipped Blue
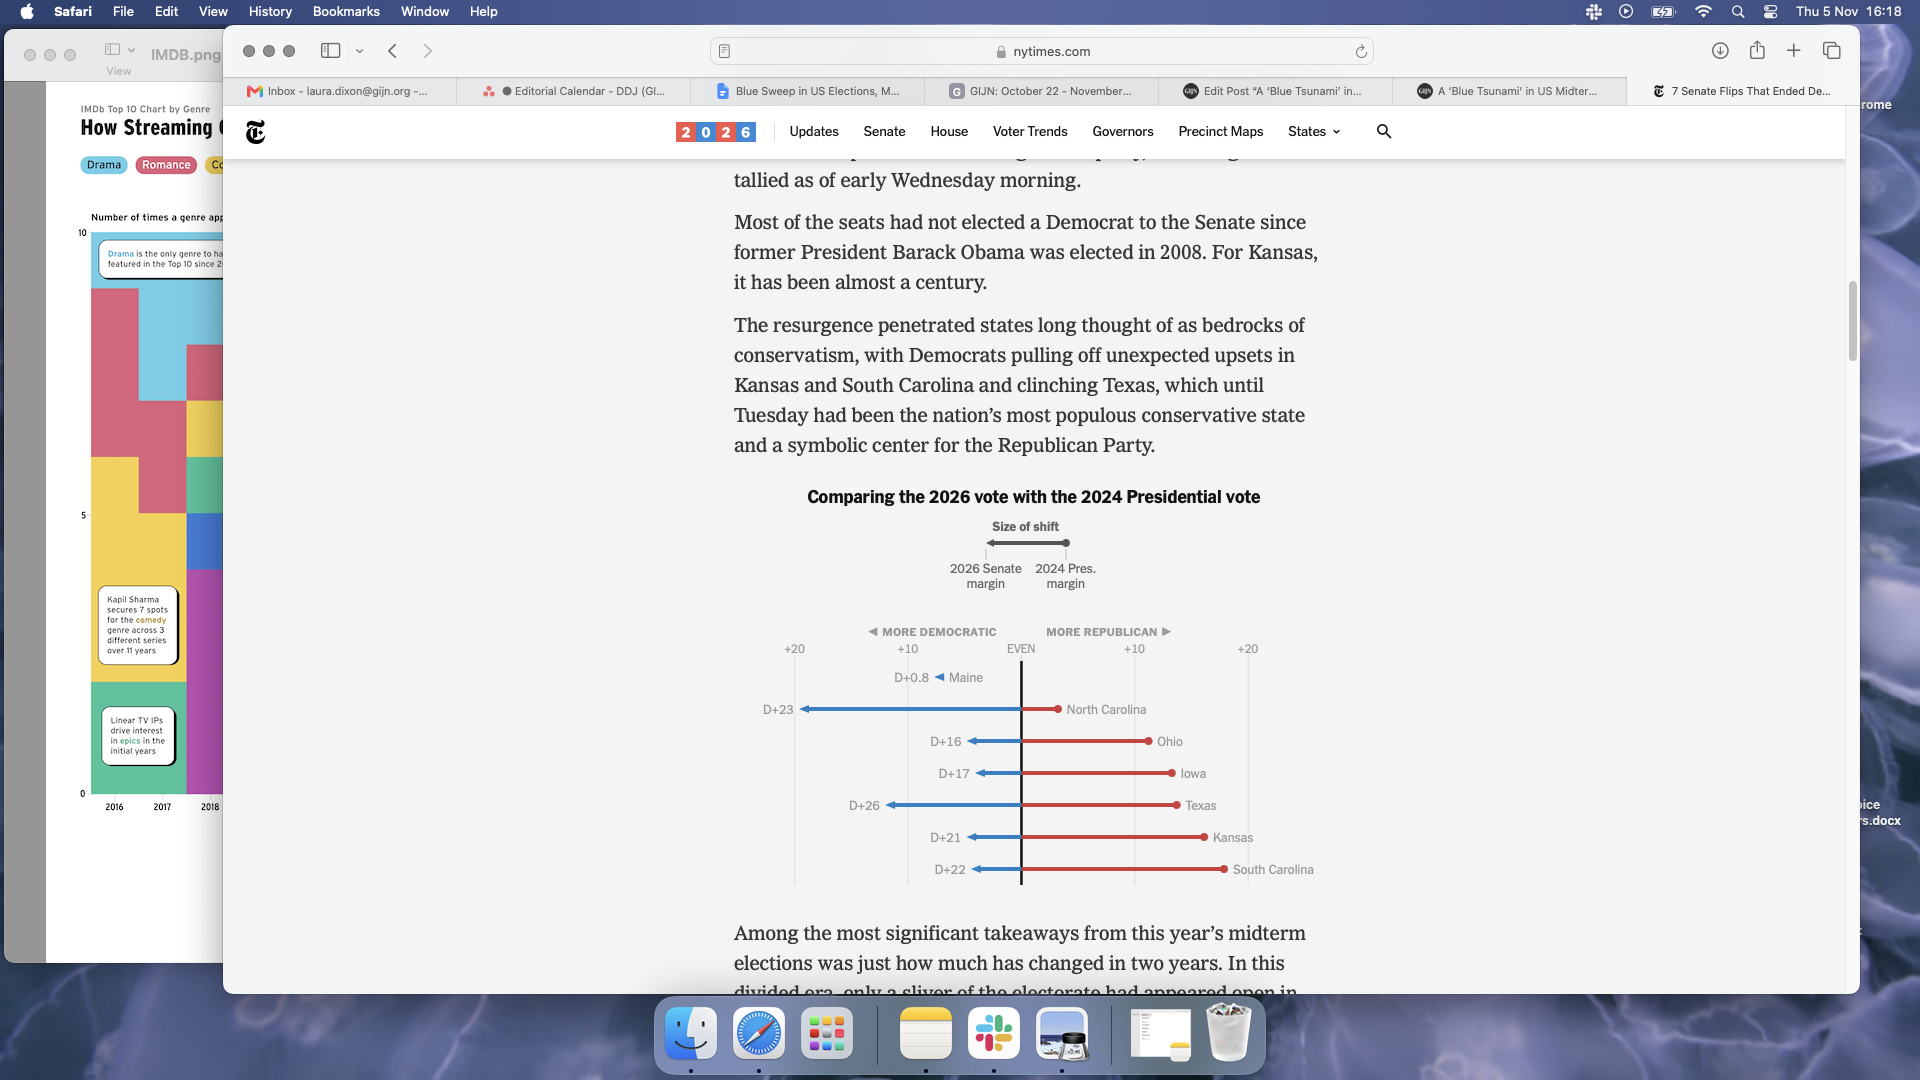
Image: Screenshot, The New York Times
Democrats took back both the Senate and the House of Representatives in the US midterm elections in what was swiftly dubbed a “blue tsunami.” Democrats have flipped at least seven Senate seats — winning in states that had long been out of reach for the party as voters, frustrated with corruption, the cost of living, and the war on Iran, turned away from Republicans. Using election results from the Associated Press and data from the MIT Election Data and Science Lab and the US House Clerk’s Office, The New York Times analyzed the outcome of the Senate races. It found that five of the flipped seats had not gone to a Democrat since 2008 or earlier; Kansas last elected a Democratic Senator nearly a century ago. A series of swing maps used arrows to illustrate county-level shifts toward either party, showing that counties moved toward Democrats across all six states, which at the time of reporting had reported more than 95% of votes, including surprise wins in Texas and South Carolina.
How Much Did Elon Musk Spend on the Midterms?
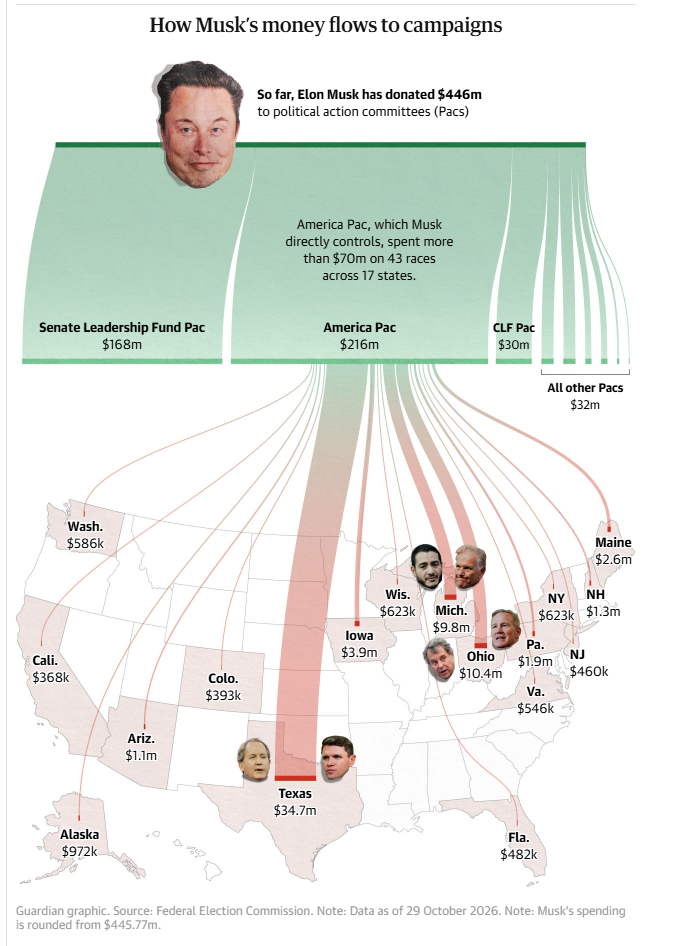
Image: Screenshot, the Guardian
Elon Musk’s record spending on US midterms failed to pay off on election night as Democrats won key races into which he had poured money, including the Texas Senate seat. Despite stating in May 2025 that he would scale back his political donations, the world’s richest man had given US$446 million to Republican-aligned political action committees (PACs) by late October, according to a Guardian analysis of Federal Election Commission data. A Sankey diagram traced how the money flowed, with the largest share of US$216 million going to Musk’s own America PAC, and a further US$168 million going to the Senate Leadership Fund. The Sankey diagram, combined with a map of US states, shows America PAC’s spending across 17 states; Texas took the biggest cut, with US$34.7 million, mostly to back Republican Ken Paxton against Democrat James Talarico. A bubble chart compared Musk’s donations with those of other major tech donors, showing that he spent 84% more than in the 2024 presidential election.
Mapping Europe’s Protests
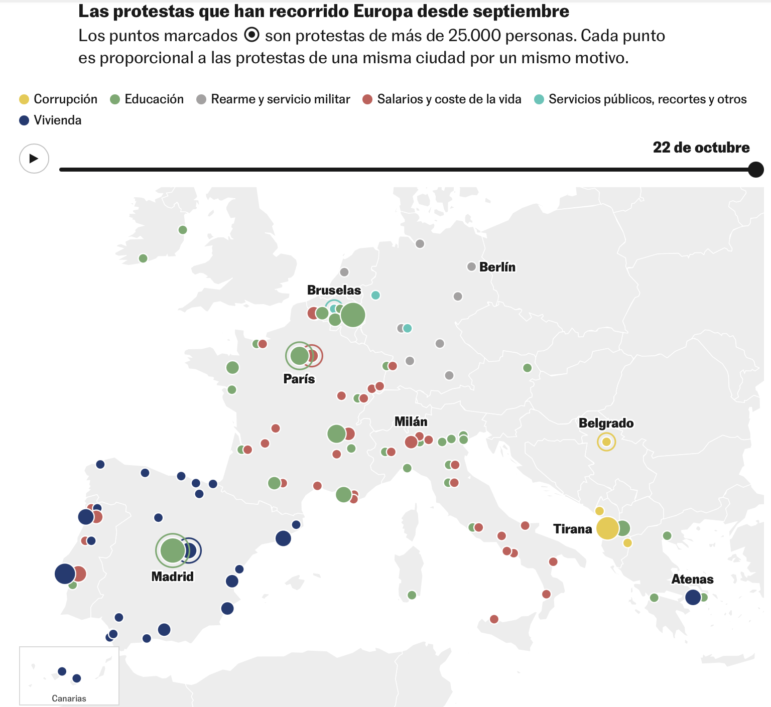
Image: Screenshot, El País
A wave of protests has swept across Europe in recent weeks, as anger over the condition of schools and the cost of living brought people to the streets. El País compiled data from news agencies, media outlets, and official sources, and counted at least 177 demonstrations against government measures in 12 countries between September 15 and October 23. A line chart tracked the running total of protests in each country, showing that France, Spain, Italy, Portugal, and Belgium made up 80% of the total. France has been at the center of the mobilizations over the state of schools and the cost of living, which later spread to Italy and Belgium; in Spain, housing has been the main grievance. A bar chart showed that class sizes in France and Spain are larger than the OECD average, while line charts revealed that both rent and consumer prices across Europe remain well above their 2022 levels. Elsewhere, corruption has fueled protests in Albania and Serbia, with a bar chart showing that people in much of the EU see it as a widespread problem in their own country, according to Eurobarometer data.
Closer Look at US Inflation Data
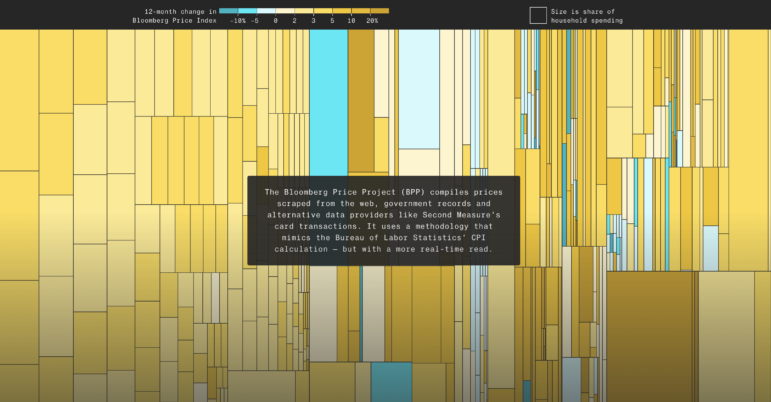
Image: Screenshot, Bloomberg
Rising prices weighed heavily on US voters as they headed to the polls, with official inflation at 3.7% and both the Federal Reserve and bond markets expecting it to stay elevated for the foreseeable future. To get a faster, more detailed read, Bloomberg Economics built the Bloomberg Price Project, which tracks prices from websites, card transactions, and government records using the same method as the Bureau of Labor Statistics’ Consumer Price Index (CPI) calculation. Its headline figure came in even higher, at 4.4% in September. But once extreme price swings across more than 30,000 products were stripped out, underlying inflation fell to 2.2%, close to the Fed’s 2% target. A treemap broke the consumer basket down by product, with each tile sized by its share of household spending and colored by its price change over the past year. It showed that while most items are getting more expensive, some are getting cheaper. The analysis found that this year’s increases come from a narrow group of goods, mainly those tied to the AI boom and the war-driven rise in oil prices, whereas in 2022, price rises spread across far more categories.
Population Displacement from War in Lebanon
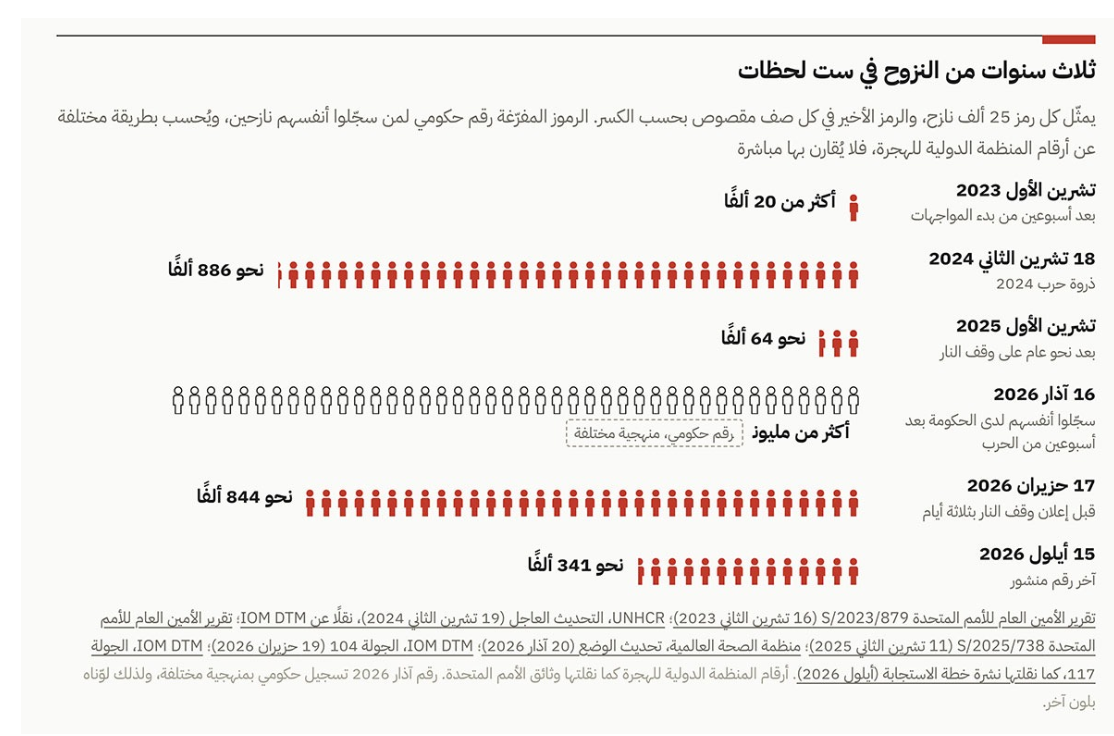
Displaced persons in southern Lebanon due to conflict, 2023 – 26. Image: Screenshot, Raseef22
Conflict has driven a new wave of displacement in the south of Lebanon. Despite a June ceasefire between Israel and Hezbollah, about 341,000 people remained displaced from their homes in the south of Lebanon in September. Beirut-based news site Raseef22 investigated why so many have been unable to return, analyzing satellite imagery and UN displacement and damage data alongside interviews with people who have been uprooted. A pictogram traced three years of displacement in six waves. It rose to about 886,000 people at the peak of the 2024 war and fell to about 64,000 in 2025, before government registrations of displaced people surpassed one million two weeks into the latest conflict, which began in March this year. Side-by-side satellite maps of NASA’s Black Marble nighttime light data compared September 2025 with September 2026, showing the south far darker after the war, particularly around border villages. Another pictogram, based on UN satellite damage assessments, showed that one in seven surveyed buildings had been destroyed by mid-June, with a map showing that the destruction was concentrated within five kilometers (3.1 miles) of the border.
Neglected Land and European Wildfires
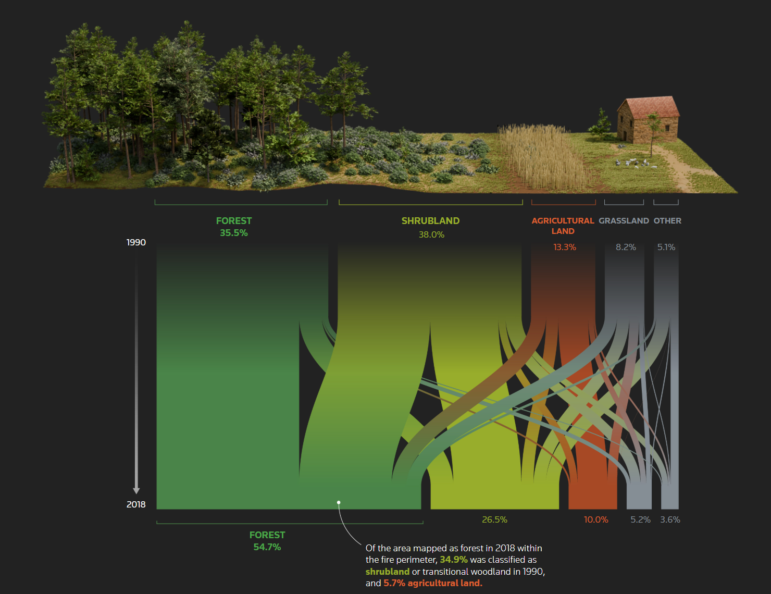
Image: Screenshot, Reuters
Wildfires burned 699,000 hectares (1.7 million acres) across Europe this year, with Spain, France, and Greece among the hardest hit. Reuters investigated how neglected rural land helped fuel Spain’s most devastating fire in decades, which broke out near the mountain village of Burgohondo, west of Madrid, in July and had burned through 63,000 hectares by the time it was fully extinguished in October. Reporters studied historical and current imagery of the area, used NASA FIRMS (Fire Information for Resource Management Data, which uses satellite images to detect active fires and thermal anomalies), reviewed land cover inventories and ownership records, and spoke with forestry officials and local landowners. A swipe map comparing aerial images from the mid-1950s overlaid onto present-day satellite views show how fields turned into woodland after millions of Spaniards abandoned rural areas for cities. A map of the burn zone found that forest cover within the fire’s boundary had expanded by 54% from 1990 to 2018. A Sankey diagram tracked how each type of land shifted over those years, revealing that over a third of what counted as forest by 2018 had been scrubland in 1990.
China’s Growing Expansionism at Sea
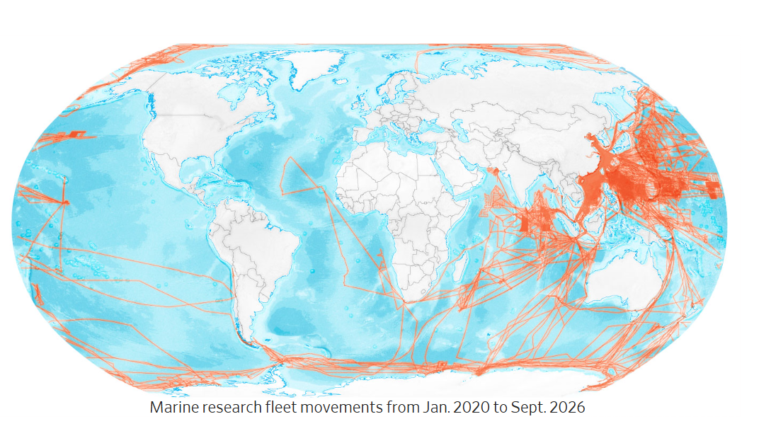
Image: Screenshot, The Wall Street Journal
China now has the world’s largest navy by vessel number, with more than 400 warships and submarines, about 35% more than the US, according to US government figures obtained by The Wall Street Journal. The Journal used satellite imagery, ship-tracking data, and US intelligence estimates to show how quickly Beijing has built up its fleet. A treemap showed that China built more than half of the world’s cargo ships in 2025, and an analysis of satellite images of Changxing Island, near Shanghai, revealed that warships are being built in the same yards as commercial vessels. A map of aircraft carrier movements showed Chinese deployments pushing steadily further into the Pacific each year, while a scroll-driven map traced Chinese-financed ports and research vessel routes worldwide. A final map based on Taiwanese security data, showed dozens of clusters of Chinese naval and coast guard ships spread across the East and South China Seas on a single day in July this year, surrounding Taiwan and stretching as far as waters off Japan and the Philippines, causing concern in Washington about Beijing’s war readiness.
Scorpions, Electrocutions, Fireworks: Analyzing Rare Causes of Death in Mexico
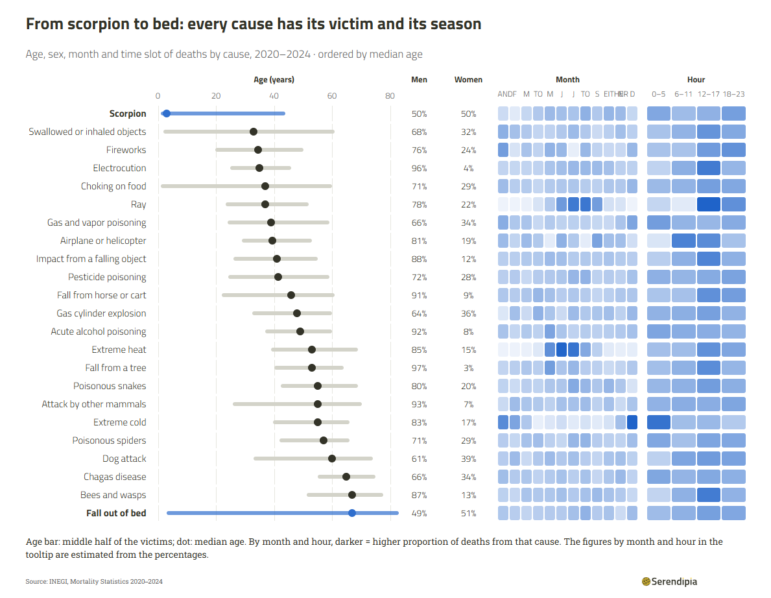
Image: Screenshot, Serendipia
Scorpion stings, electrocution, and choking on food are among the rarer causes of death in Mexico, yet each claims hundreds of lives every year. Serendipia analyzed nearly 4.7 million death records from INEGI, Mexico’s national statistics agency, to find out who dies from these causes and when. A bar chart ranked 31 unusual causes that together accounted for 12,639 deaths between 2020 and 2024, with electrocution the most common. A chart combining range plots and heatmaps broke down each cause by the victims’ age and gender and by the month and time of day. It revealed that scorpion stings mostly killed young children, with a median age of three, while bee and wasp stings mainly killed people in their 60s. Men made up the vast majority of victims for most causes, including 96% of electrocution deaths. The heatmaps also picked up seasonal patterns, with heat deaths peaking in summer and cold-related deaths clustering in the early hours of the morning. Line charts tracked how natural deaths, accidents, and homicides are spread across the day, with homicides peaking around midnight. An interactive column chart showed that New Year’s Day records more deaths than any other date, and a hexagon map compared which unusual causes were most common in each state.
How ‘Frontex in the Sky’ Controls Borders
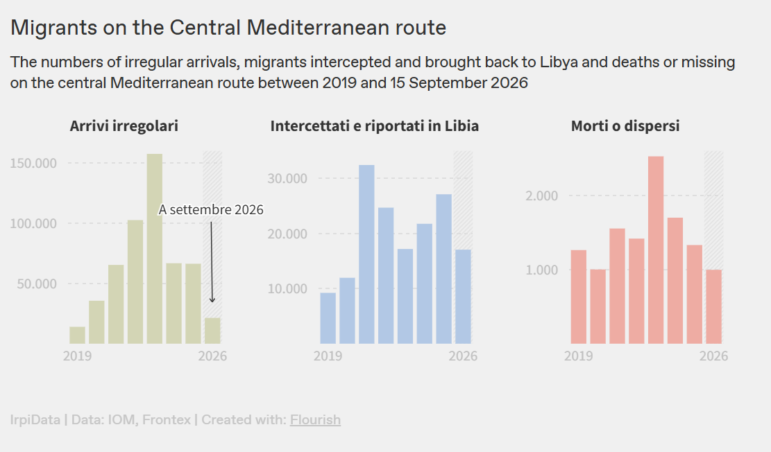
Image: Screenshot, Irpi Media
The European Union’s border agency, Frontex, is pouring money into aerial surveillance of the Mediterranean, setting aside €1.2 billion (US$1.3 billion) for drones and planes between 2018 and 2028. IrpiMedia worked with Liminal, a research lab at the University of Bologna, to analyze Frontex procurement contracts and flight paths. A chart of estimated annual spending showed the budget surging from around €12 million ($13.5 million) in 2018 to more than €277 million ($311 million) this year. The aircraft are rented from defense companies such as Airbus, Leonardo, and Elbit Systems. The investigation found that the location data collected was shared with Libyan and Tunisian authorities, helping them intercept migrant boats and return at least 33,000 people between 2018 and 2024. A second chart tracked arrivals, interceptions, and deaths on the central Mediterranean route since 2019. It showed that while arrivals have fallen sharply, deaths have not fallen as sharply, with 2,292 people dead or missing so far in 2026, more than in the previous year.
Crime Dramas Dominate Indian Streaming Services
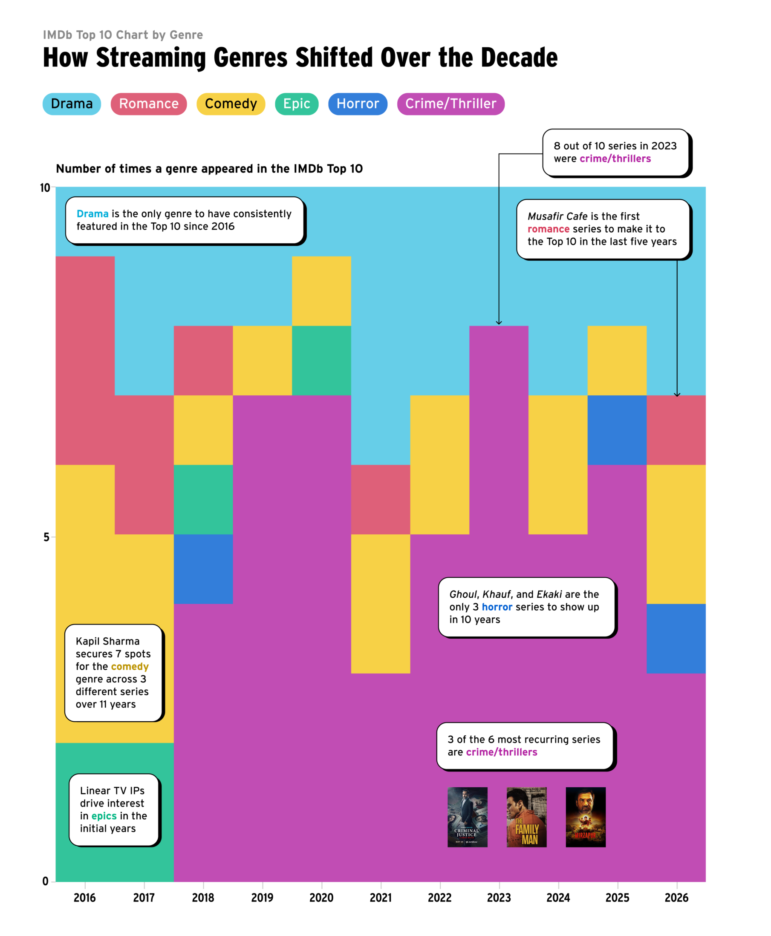
Image: Screenshot, IMDB/Revisual Labs
Ten years ago, Netflix and Prime Video arrived in India, changing streaming and what Indians watch — with interest in Indian series on IMDb growing 17-fold. IMDb analyzed a decade of page-view data to tell the story of India’s streaming boom. An annotated timeline traced the industry’s key phases, spanning the arrival of subscription services to the pandemic, when major films began premiering online. A grid of each year’s 10 most popular series showed a handful of hits, such as the crime series “Mirzapur” and comedy-drama “Panchayat,” returning again and again. A stacked block chart broke the rankings down by genre, revealing how crime thrillers have come to dominate, while horror and romance have rarely broken through in recent years.
Hanna Duggal is the writer of GIJN’s fortnightly Top 10 in Data Journalism column, and a data journalist at AJ Labs, the data, visual storytelling, and experiments team of Al Jazeera. She has reported on issues such as policing, surveillance, and protests using data, and reported for GIJN on data journalism in the Middle East, investigating algorithms onTikTok, and on using data to investigate tribal lands in the US.
How Many Journalists Does It Take to Fill an Olympic Swimming Pool? GIJN’s Guide to Size and Number Comparisons
Investigative Journalism Week 2026 Resources
International Research Guide: How to Find Experts and Hidden Documents on Any Topic
Guide to Investigating Tech and AI in Modern Warfare
How Russia Censors Foreign TV, Midterm Battle for US Congress, Venezuela’s Collapsed Housing Towers, France’s Education Protests

How Gillian Brockell Investigates ICE Removal Flights from US
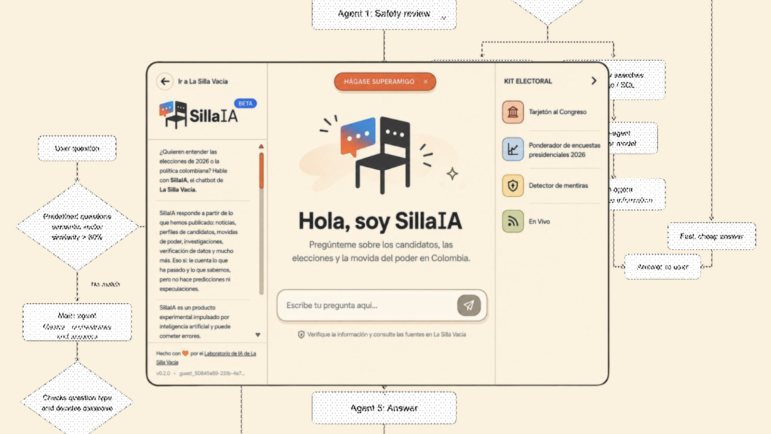
What We Learned Building a Chatbot for La Silla Vacía’s Newsroom Archive

Fiquem Sabendo: ‘An Engine for Brazilian Journalism in the Search for Information’

This work is licensed under a Creative Commons Attribution-NoDerivatives 4.0 International License
Republish our articles for free, online or in print, under a Creative Commons license.
Republish this article
This work is licensed under a Creative Commons Attribution-NoDerivatives 4.0 International License
Read Next
Data Journalism Top 10
How Russia Censors Foreign TV, Midterm Battle for US Congress, Venezuela’s Collapsed Housing Towers, France’s Education Protests
Also highlighting police response to demonstrations in India, where European Nobel laureates do their research, and shrinking food budgets in Indonesia.
My Favorite Tools
How Gillian Brockell Investigates ICE Removal Flights from US
Since August 2025, this former Washington Post reporter, now working freelance, has written dozens of stories mapping the Trump administration’s massive, third-country deportation apparatus.
Tech & AI
What We Learned Building a Chatbot for La Silla Vacía’s Newsroom Archive
We spent 12 months building an AI tool for our independent news site in Colombia. Here’s what it taught us about running a newsroom in the age of AI.
Member Profiles
Fiquem Sabendo: ‘An Engine for Brazilian Journalism in the Search for Information’
Journalist Léo Arcoverde started a blog in 2015 publishing one story a day based on information obtained through Brazil’s new access-to-information law. The initiative eventually became Fiquem Sabendo.