
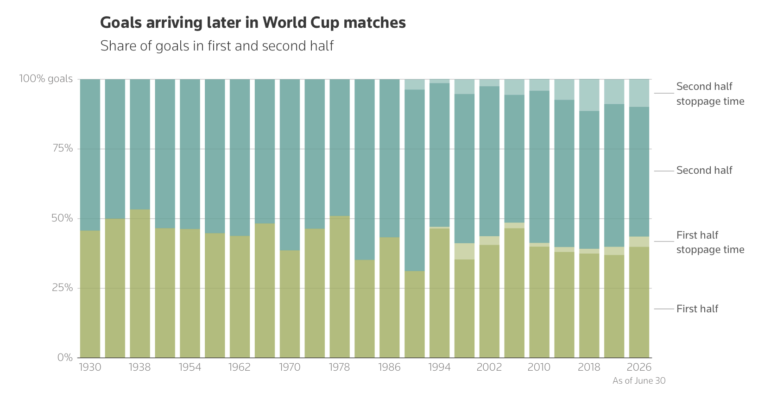
The 2026 World Cup has seen the recent trend continue where more goals are being scored in stoppage time. Image: Screenshot, Reuters
Late World Cup Goals, Foreigners Fueling Sudan’s War, Venezuela’s Deadly Double Earthquake, and Fatal SUV Blindspots
A joint investigation has revealed how the UAE and Libya’s National Army are smuggling weapons and running training camps to arm Sudan’s Rapid Support Forces. That civil conflict has killed an estimated 400,000 people since 2023. Evident, Lighthouse Reports, and Sudan War Monitor spent a year tracing smuggling routes from Kufra to Chad, using location data to place Colombian and Argentinian mercenaries inside training camps near Kufra. Our roundup of the Top 10 in Data Journalism, looking at stories from June 18 to July 7, also includes a Reuters analysis of how more World Cup goals are being scored in stoppage time after the 90-minute mark, a New York Times investigation into how bigger SUVs are killing more pedestrians, and an Airwars conflict report tracking the civilian casualties of the first 40 days of the Iran war.
Fueling Sudan’s War
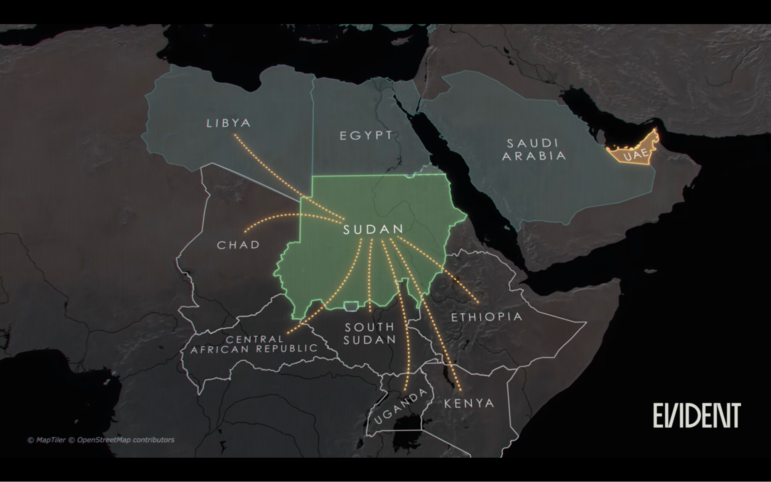
Image: Screenshot, Evident, Lighthouse Reports, and Sudan War Monitor
Sudan’s civil war, being fought between the army and the paramilitary Rapid Support Forces, has killed an estimated 400,000 people in the past three years and has drawn foreign backers on both sides. Evident, Lighthouse Reports, and Sudan War Monitor spent a year investigating the UAE’s and the Libyan National Army’s entrenched role in smuggling weapons and running training camps in southern Libya, interviewing seven RSF defectors who passed through the camps. Reporters built an archive of more than 500 verified TikTok, Facebook, and Telegram clips, geolocated and cross-checked against uniforms, vehicles, and social network ties to the RSF and LNA, alongside satellite imagery tracking smuggling routes from Kufra to Chad across the Sahara. Using adtech location data from Conflict Insights Group, the investigation also placed phones belonging to Colombian and Argentinian mercenaries inside Camp 17, an LNA base near Kufra used for training RSF fighters. The UAE, Libya’s Haftar government, and the RSF all denied involvement.
SUVs Getting Bigger — and Deadlier
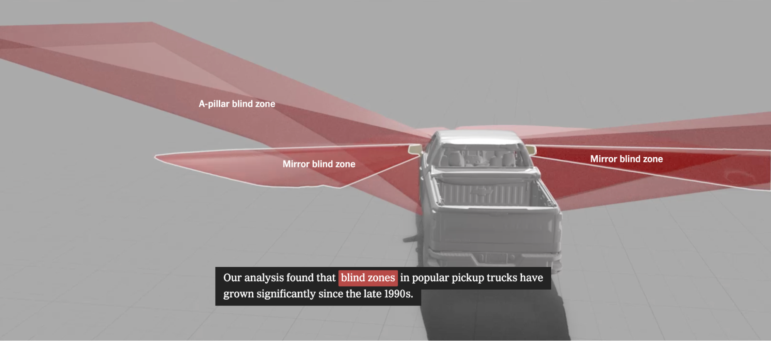
Image: Screenshot, The New York Times
A New York Times investigation found that the growing size of pickup trucks and SUVs that dominate the roads in the US has contributed to 200-400 pedestrian deaths a year that would not have occurred had vehicles stayed the same size since 2002, reversing a decline in pedestrian deaths that had held until around 2009. Reporters built a logistic regression model using federal crash data from the National Highway Traffic Safety Administration (NHTSA), hood-height measurements, and vehicle registration records. They found that each one-inch increase in hood height raised the odds of a pedestrian fatality by 2.8%, translating to about 3,000 additional deaths from 2016 to 2024. To measure blind zones, the team used a 3D structured-light scanner to build side-by-side models comparing four popular pickups — the Chevy Silverado, Ford F-150, GMC Sierra, and Toyota Tacoma — from the 1990s and early 2000s against their modern counterparts, finding the Silverado’s blind zone had nearly doubled, while the Sierra’s and Tacoma’s grew by about 60% and the F-150’s grew by about 25%.
Late Goals in the World Cup
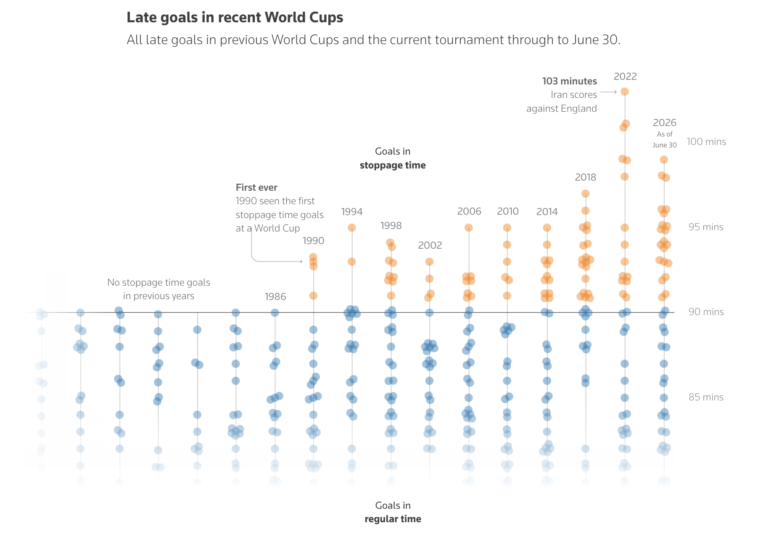
Image: Screenshot, Reuters
Deep into stoppage time — extra minutes added to each half of a soccer match to make up for delays during play — on June 29, Gabriel Martinelli squeezed a shot inside the far post to hand Brazil a thrilling 2-1 win over Japan, knocking Japan out of the tournament in the last seconds and exemplifying a pattern common across the 2026 FIFA World Cup: goals are increasingly being scored after the 90-minute mark. Reuters analyzed World Cup goal-timing data and found that as of July 2, second-half stoppage time had produced 22 goals. Reporters traced the shift to lengthening match times, where average stoppage time has nearly quadrupled since 1990, from roughly 3 minutes to 11.2 minutes by 2022, and has climbed past 14 minutes so far in 2026, partly due to newly mandated “hydration breaks.” More substitutions and late-game pressing fatigue, the analysis noted, are also raising the likelihood of decisive goals in a match’s closing stages.
Investigating a Wildlife Trafficker
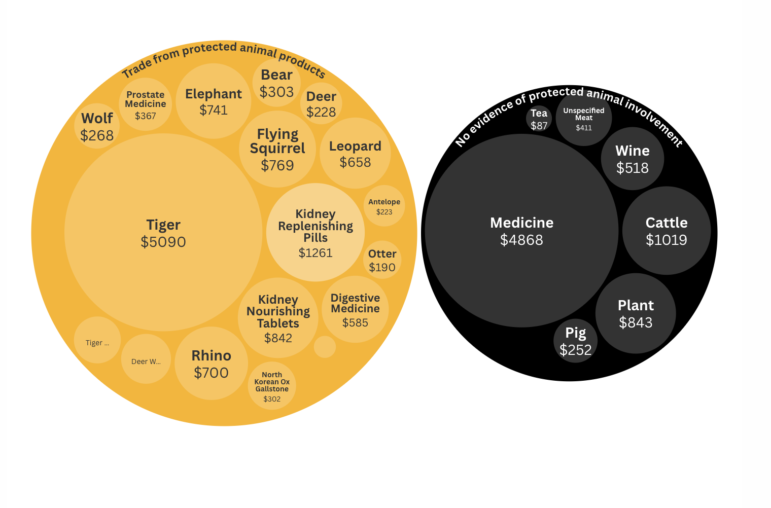
Image: Screenshot, Bellingcat
A Bellingcat investigation found a Myanmar-based wildlife trafficker, referred to as MB in the investigation, had operated openly across Facebook, Viber, and WeChat for at least six years, selling tiger bones, rhino horn, elephant skin, and other endangered species products to buyers in Myanmar, China, and Thailand. Analyzing more than 500 screenshots of reposted customer conversations from May 2021 to May 2026, reporters traced over 150 transactions worth US$21,000 and geolocated MB’s home in Lashio, eastern Myanmar. A bubble chart broke down MB’s income by protected versus non-protected species, and a map visualized 119 recorded deliveries within Myanmar, 27 to China, and 9 to Thailand, based on Bellingcat’s analysis of MB’s digital footprint. Following the investigation, Meta removed 10 Facebook accounts, WeChat suspended three, and TikTok and YouTube each removed one.
How Strong Were Venezuela’s Earthquakes
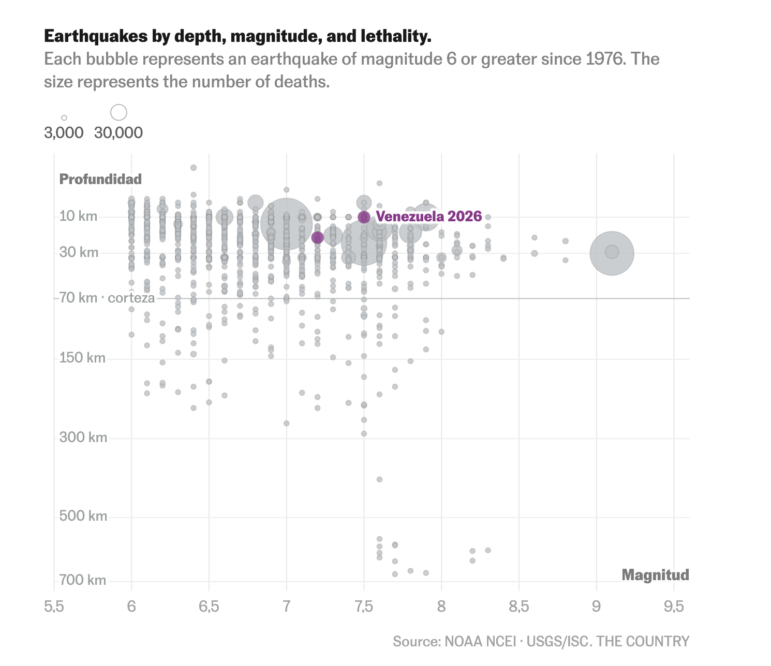
Image: Screenshot, El País
Two earthquakes struck northern Venezuela on June 24 — a 7.2 magnitude quake followed 38 seconds later by a 7.5 magnitude one centered near Yumare and Montalbán on the Boconó fault. El País mapped both epicenters using a bar chart to show the US Geological Survey’s (USGS) probabilistic death-toll estimates and built a heat-map table ranking over 140 affected towns with populations over 1,000 that were affected by seismic intensity. Venezuela’s government put the official toll at 920 dead and 3,300 injured, though USGS modeling gives a 59% chance that the true toll exceeds 10,000. A bubble chart plotting magnitude, depth, and death toll for global earthquakes since 1976 showed the recent earthquake’s shallow depth as a key factor in its lethality; a companion timeline chart found it to be the region’s most powerful shallow earthquake since a 7.7 magnitude quake in 1900, alongside a map of tectonic plate boundaries and historical quakes since 1960.
Tracking 40 Days of the US-Iran War
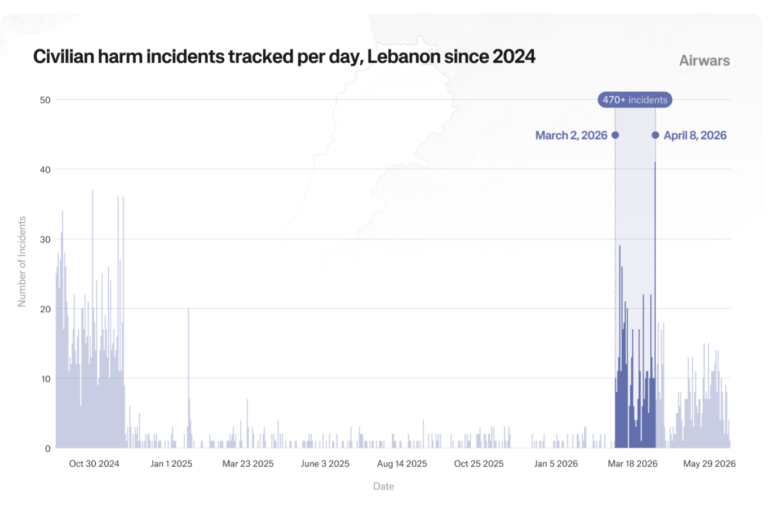
Image: Screenshot, Airwars
Airwars launched a conflict page documenting the human toll of the first 40 days of the US-Israel-Iran war across the Gulf, tracking nearly 1,000 incidents of civilian harm in at least 14 countries, from mass casualty events in Iran to seafarers attacked in the Strait of Hormuz. Researchers built the dataset by cross-referencing an evolving list of open sources — including news outlets, journalists, and Telegram channels — to pinpoint each incident’s time and location, presenting findings through bar charts and maps tracking civilian harm across Iran, Israel and the occupied West Bank, Lebanon, and the Persian Gulf. Iran saw civilian harm every day of the war, with nearly 300 incidents logged in the first 40 days, including 19 in a single day at its peak. Israel and the occupied West Bank recorded over 100 incidents, while Lebanon — excluded from April’s ceasefire — recorded more than 470. The Gulf logged 47 incidents, nearly half in the UAE.
Carbon Capture Won’t Solve the Climate Crisis
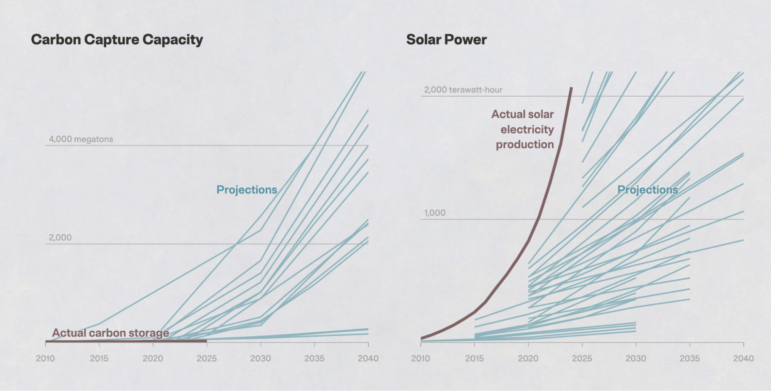
Image: Screenshot, ProPublica
An investigation by ProPublica and Drilled found that advocates of carbon capture and storage (CCS) have overstated the technology’s potential for nearly two decades. Reporters compared International Energy Agency (IEA) projections since 2008 against actual deployment, finding the world buries less CO2 annually than a single large power plant emits. To meet a 2050 target of six billion tons stored yearly, the investigation calculated the world would need 768,000 square miles of land for carbon-absorbing crops, tens of thousands of miles of new pipeline, dozens of specialized tankers, and 2,000 large-scale storage reservoirs — compared to just 12 reservoirs and three ships that exist today for CCS. Illustrated visuals of the capture-and-burial process accompany projection charts comparing IEA forecasts of solar-powered electricity generation to actual deployment, revealing that the modelers behind CCS’s inflated projections have also consistently undersold solar power, a technology doing more to keep oil in the ground.
India’s Prisoners Awaiting Trial
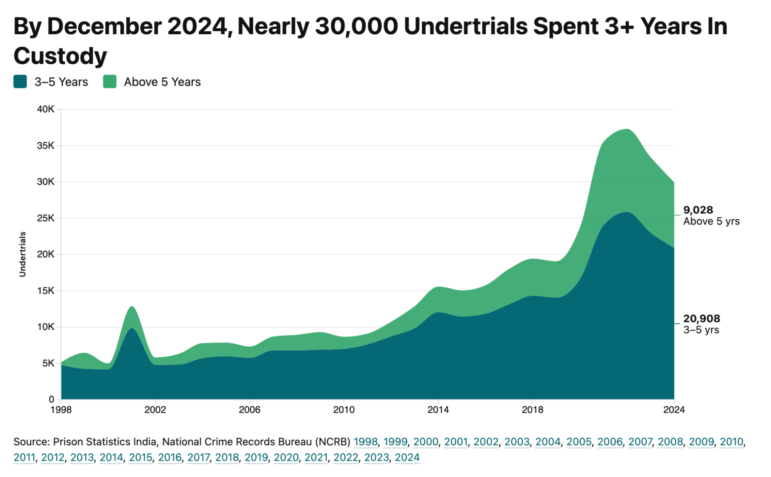
Image: Screenshot, IndiaSpend
Nearly three in four prisoners in India are considered “undertrials” — held in custody while their cases remain pending — and the typical undertrial is young, poorly educated, and from a marginalized community. An IndiaSpend analysis of National Crime Records Bureau data found India’s prisons, built for 450,000 inmates, housed 511,000 people by the end of 2024, 13% over capacity, with 371,440 of them undertrial, up from 66.2% of the prison population in 2005 to 72.6% today. Two in three undertrials belong to Scheduled Caste, Scheduled Tribe, or Other Backward Class communities — Indian government terms for historically marginalized groups. Bihar, Maharashtra, Delhi, and Jammu and Kashmir recorded the highest undertrial shares among major states. Reporters attributed the disparity to caste prejudice and poor legal aid, presenting the data through area charts tracking education levels, caste representation, and time spent in custody.
The UK Will Scan Asylum-Seekers’ Faces
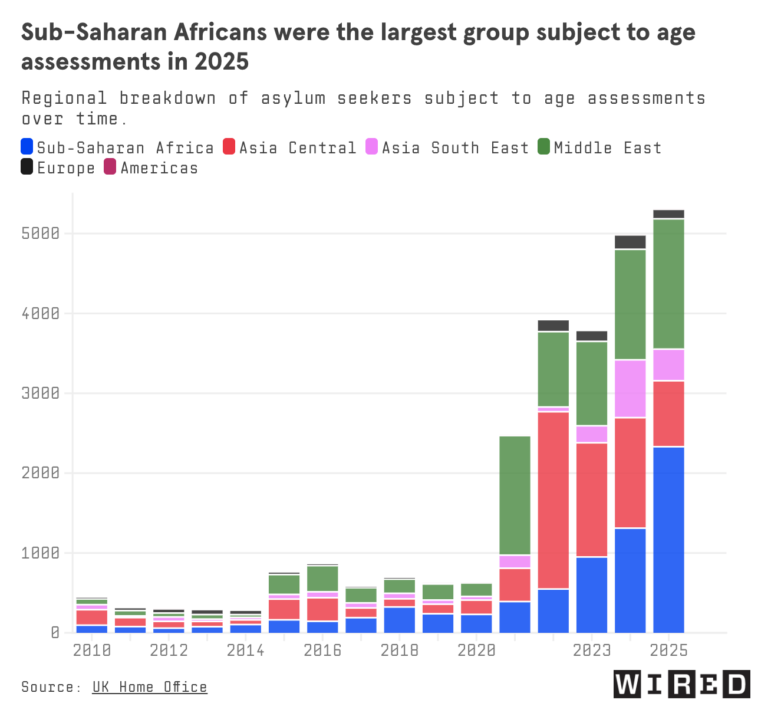
Image: Screenshot, Wired
An investigation by WIRED and Lighthouse Reports, in collaboration with The Independent, obtained an internal UK government report detailing tests of facial age estimation (FAE) technology that the Home Office — the government department that oversees immigration and security — plans to deploy on asylum seekers starting next year. It is believed to be the first use of such a system at a national border. The investigation found the system misjudged the age of female sub-Saharan Africans — the largest group crossing the English Channel by small boat from France — by an average of 4.6 years, meaning a child could be classed as an adult. WIRED and Lighthouse Reports’ analysis of public data on Cognitec’s FAE system, one of seven algorithms tested by the Home Office, found it misclassified twice as many 16-year-olds as 18-year-olds or older when tested on lower-quality border photos versus visa images. The findings were presented through a series of column and bar charts showing how certain ethnic groups were more likely to be misclassified as older.
How Old Are You Compared to the World?
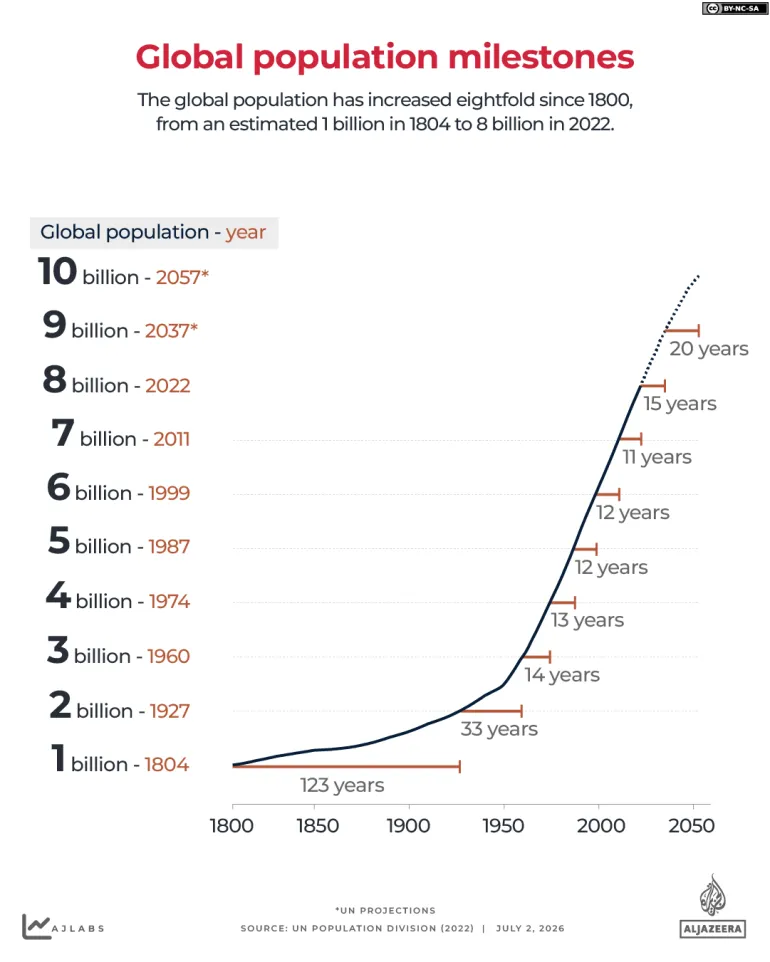
Image: Screenshot, Al Jazeera
Al Jazeera built an interactive tool that lets readers enter their date of birth to see where their ages rank among the 8 billion people alive today — what share of the world and of individual countries is older or younger than they are. Drawing on United Nations Population Division data, the analysis found the median global age has risen from just under 21 in 1976 to 31 today, and is projected to reach 36 by 2050, driven by a global fertility rate of 2.2 — barely above the 2.1 replacement level and down from roughly five in the 1960s. More than half of countries, including China, the US, India, and Japan, are already below replacement level. The piece uses interactive charts, a population pyramid, and an animated timeline tracking growth from 2.5 billion in 1950 to 8 billion in 2022, projecting a peak of 10.3 billion by the mid-2080s, with India, Nigeria, and the US among the most populous nations by 2050.
Hanna Duggal is a data journalist at AJ Labs, the data, visual storytelling, and experiments team of Al Jazeera and a GIJN contributor. She has reported on issues such as policing, surveillance, and protests using data, and reported for GIJN on data journalism in the Middle East, investigating algorithms onTikTok, and on using data to investigate what tribal lands in the US.

Guide to Investigating Tech and AI in Modern Warfare
Turning Copernicus Satellite Data Into Public-Interest Climate Stories
10 Practical Tips for Verifying Scientific Claims

Reporter’s Guide to Investigating Cryptocurrency

Visualizing a Trillion Dollars, India’s Warming Cities, Russian Mercenaries at Sea, and World Cup Player Physiques
Data Journalism Top 10: Global Water Stress, Fentanyl Proliferation, Maui Fires

Data Journalism Top 10: A Scorched Earth, Hot French Baby Names, and Women’s World Cup Stars to Watch
Data Journalism Top 10: World Cup Odds, Upward Economic Mobility, Wartime Dreams, Noisy Charts

This work is licensed under a Creative Commons Attribution-NoDerivatives 4.0 International License
Republish our articles for free, online or in print, under a Creative Commons license.
Republish this article
This work is licensed under a Creative Commons Attribution-NoDerivatives 4.0 International License
Read Next
Data Journalism Top 10
Visualizing a Trillion Dollars, India’s Warming Cities, Russian Mercenaries at Sea, and World Cup Player Physiques
Also highlighting how films portray Ukrainians, increasing tree cover in Spain, and how couples meet.
Data Journalism Data Journalism Top 10
Data Journalism Top 10: Global Water Stress, Fentanyl Proliferation, Maui Fires
With stories about global water stress, the boom in fentanyl trafficking at the US-Mexico border, the devastating fires in Maui, and strategies for taking penalty kicks.
Data Journalism Data Journalism Top 10
Data Journalism Top 10: A Scorched Earth, Hot French Baby Names, and Women’s World Cup Stars to Watch
This week’s column features stories on the record-breaking global heat, popular French baby names, Russia’s war dead, and the likely breakout stars of the 2023 FIFA Women’s World Cup.
Data Journalism Data Journalism Top 10
Data Journalism Top 10: World Cup Odds, Upward Economic Mobility, Wartime Dreams, Noisy Charts
Our weekly NodeXL and human curation of the most popular data journalism stories on Twitter features 2022 World Cup odds and carbon promises, the legal consequences of France’s #MeToo movement, and the problem of pig farm pollution.