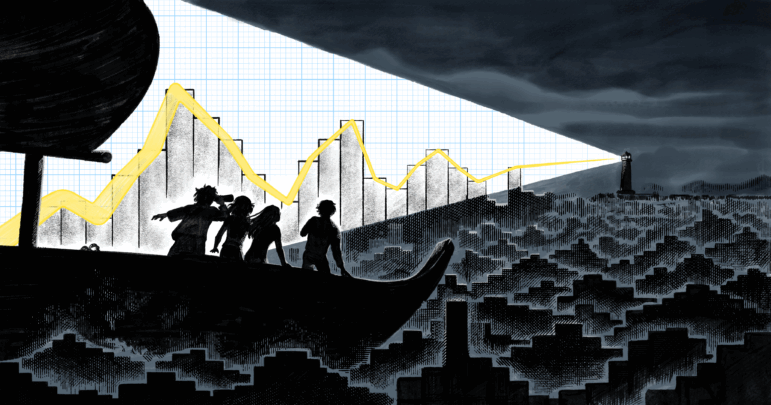
Image: Nyuk for GIJN
Data Journalism in Asia: Rethinking the Relationships Between Newsrooms, Communities, and Evidence
Read this article in

Introduction to Investigative Journalism: Data Journalism

Harnessing the Power of Global Forest Watch for Data-Driven Reporting on Land Cover Change

Tipsheet for Using Ocean Data in Your Investigations

Unlocking the Secrets of Algorithms: Q & A with Investigative Data Journalist Leon Yin
Data journalism newsrooms across Asia have found innovative ways to navigate closed data regimes, political pressures, and resource gaps by finding distinct core missions and novel storytelling methods. Examples of standout data journalism initiatives in India, Singapore, Thailand, and the Philippines showcase diverse approaches to overcoming the evolving challenges arising from media environments and in the use of data by governments and companies alike.
The region’s challenges are stark: poor data pipelines, political hostility to transparency, reliance on grants, and fragile newsroom buy-in. But the creativity of storytelling methods — from visual art to AI chatbots and teaching workshops — is striking, and shows that data journalism in Asia is not just about charts and dashboards; it is about rethinking relationships between newsrooms, communities, and evidence.
This creativity and impact was evident in this year’s Sigma Awards, where numerous Asian outlets, including Macaranga Media, Al Jazeera, Kontinentalist, Reuters (Singapore), CommonWealth Magazine, The Reporter (Taiwan), Independent Palestinian Media, a South Korean collaboration, and a number of Asian outlets working on the global Dubai Unlocked project were shortlisted. The South China Morning Post was ultimately among the 2025 portfolio winners for its graphical deep dive into Hong Kong’s hidden communities of domestic helpers and the illegal construction that houses them, a project that the Sigma jury praised as a “remarkable series of visual stories.”
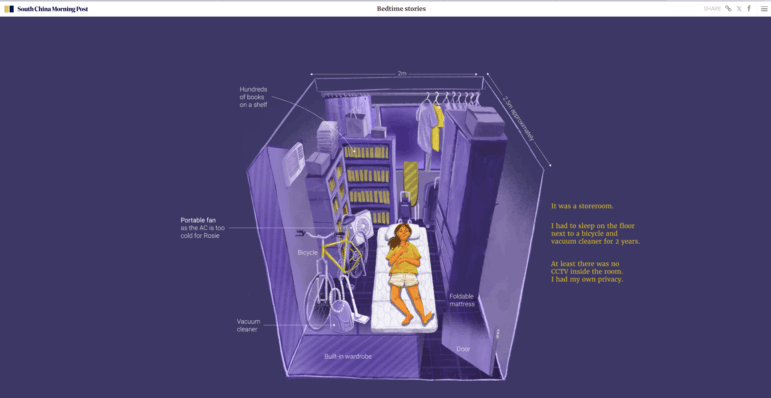
An image from the SCMP’s Sigma Award-winning data series about domestic workers in Hong Kong, many of whom live in cramped quarters and endure little privacy. Image: Screenshot
Accountability Requires Patience
GIJN member IndiaSpend was founded by Govindraj Ethiraj, the former editor-in-chief of Bloomberg TV India, in 2011 during India’s anti-corruption movement. The outlet has made accountability its core mission. India’s first data journalism initiative, reporters and editors have spent more than a decade tracking governance, health, gender, climate, and livelihoods with an eye on what the data shows and what it omits.
“Data accessibility and reliability remain key hurdles, as we often face delays, incomplete datasets, and changing methodologies. And then we also face restrictions that limit transparency,” says Prachi Salve, research manager at IndiaSpend.
But despite this, IndiaSpend files Right to Information (RTI) requests, cross-verifies figures with experts, and designs explainers and interactive visuals so citizens can use the findings themselves.
Such rigor has had a practical impact. Their investigation into factory safety revealed that government data itself showed that three workers on average died every day in registered factories between 2017 and 2020 (see graphic below). The story did not end as just another grim statistic: India’s National Human Rights Commission took suo motu cognizance — legal action without a petition by another party — and issued notices to state governments. During the pandemic, IndiaSpend’s analysis of excess mortality, rooted in official civil registration records, drew national and international attention to the devastating toll of COVID-19 in India.
In both cases, the key wasn’t just the numbers, says Salve, but patience, verification, and framing the story so it resonated beyond policy circles. “We strip away jargon, use relatable comparisons (‘one in two children in X state’ rather than percentages alone), and rely on infographics, charts, and interactive maps to make complex patterns intuitive,” adds Salve.
Making Data Accessible Through Design
The pages of Kontinentalist are replete with beautiful visuals, for instance, in Nature’s Utensils, which shows how Sri Lankan communities preserve culture through food and traditional tools.
“People often say our site looks ‘beautiful,’ but that’s not why we design the way we do. Our aim is accessibility. By that, we mean not just legibility, but friendliness and dignity. Data can be intimidating, but we want to make it welcoming,” says Pei Ying Loh, co-founder and head of Kontinentalist.
Every story starts with pen-and-paper sketches, goes through multiple rounds of iteration, and testing drafts with people unfamiliar with the subject. The result is evergreen explainers on topics such as housing inequality in Singapore, enforced disappearances in Balochistan, and the erasure of culture in Gaza — stories crafted like one on Sri Lankan cuisine to stay relevant long after the headlines fade.
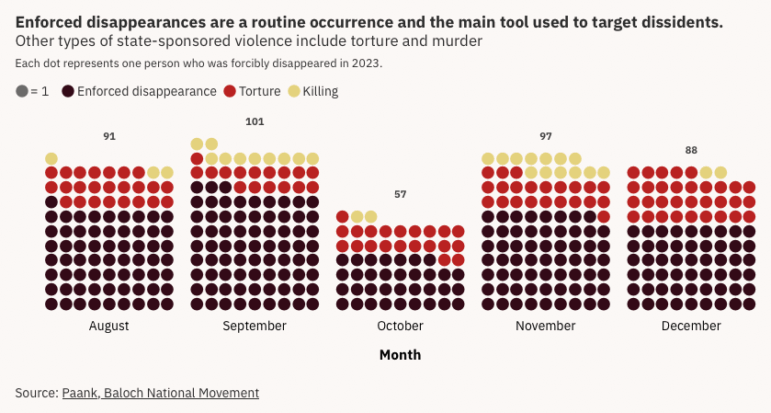
Image: Screenshot, Kontinentalist
Kontinentalist also wants to go a step further in rethinking its role in communities. Loh explains that journalism can sometimes be extractive — “where you interview someone and never return.”
“We wanted to avoid doing that by creating a Community Manifesto. It guides how we relate to readers, partners, collaborators, and especially to the communities we report on,” she says. “For example, recently we’ve been working with the Orang Laut, an Indigenous seafaring community in Singapore. Instead of just writing a story about them, we’re supporting their own data collection efforts. That’s part of our shift, sometimes the most meaningful intervention isn’t publishing another article, but strengthening a community’s capacity to tell its own story,” says Loh from the Kontinentalist.
One of the most important aspects of Kontinentalist’s Orang Laut Singapore collaboration is “empowerment” because it reframes what data journalism can mean, not by simply visualizing communities for outsiders, but enabling them to collect, own, and use their own data.

This investigation delved into disappearances related to the conflict in Balochistan. Image: Screenshot of an illustration by Meghan Poh for Kontinentalist
Teaching Newsrooms to Fish
There is an old saying that it’s better to teach someone to fish than to give them a fish; and in Bangkok, data storytelling studio Punch Up, founded in 2019, works hands-on with media partners such as Bangkok Post and others to pass on visual storytelling skills.
“At the end, we want media outlets to have their own team. We don’t want to be the only ones doing this. We want to create a culture of communicating with data,” says Patchar Duangklad, co-founder and business director at Punch Up.
Their projects span everything from helping Thai citizens understand elections to creating awareness on antibiotic resistance and decreasing forest cover. For Gone Viral, Punch Up collaborated with the Bangkok Post and a social-listening company to trace how fake news about the COVID-19 pandemic spread through Thai social media. They brought in a university professor to conduct network analysis, showing how rumours clustered and mutated across platforms.
But the point was not just the story. Punch Up set up year-long partnerships where they trained editorial teams at public broadcaster Thai PBS and other outlets to work with developers and designers, with the explicit aim of leaving behind skills and systems that staff can keep using. “We don’t want to be hired again and again for the same project. We want to push open data, create a community that can work with it, and make newsrooms confident to continue after we step back,” Duangklad explains.
That is why their work often includes boot camps and workshops. Duangklad explains that they are not only producing one-off investigations, but building the capacity for data literacy inside traditional newsrooms; a slow but “essential shift in a region where many editors still see data journalism as specialist work, rather than a core skill.”
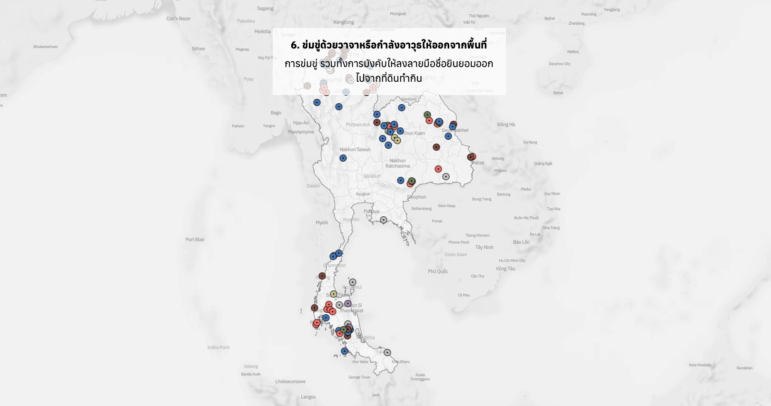
An interactive element in the special Punch Up feature on forest cover in Thailand — this map details cases and complaints affecting villagers. Image: Screenshot
Algorithms: Accountability Nobody Wants to Pay For
IndiaSpend shows the power of slow, patient data work, but the algorithm beat highlights a blind spot in data journalism. Karen Rebelo, Reuters 2025 fellow and deputy editor at Boom Live, puts it plainly: “Most of the data-driven research into the social impact of algorithms is grant-funded, and it’s not something mainstream news outlets are investing in.”
In her Reuters Institute paper examining how journalists can hold algorithms accountable in India and beyond, she writes about how algorithms affect everything from healthcare access to credit ratings for the most marginalized and vulnerable sections of Indian society. But she notes that this work is largely sustained by philanthropy and academic partnerships, not newsrooms’ own resources. Algorithm audits require specialized skills, sustained time, and, often, legal support, and she says, few commercial outlets can afford to prioritize this.
The paradox is obvious: algorithms are becoming one of the defining forces of inequality in Asia, but journalism’s oversight of them relies heavily on temporary, grant-funded projects, which Rebelo says will make accountability an occasional exercise rather than systematic and ingrained into data journalism.
When AI Bots Spark Civic Conversation
In the Philippines, a one-person experiment showed how technology can lower barriers to accountability. Jaemark Tordecilla, a freelance journalist and media advisor, uploaded the entire 2025 national budget into a custom GPT chatbot he called Budget Bot. Citizens could query the bot in plain language, asking: “Why are there dozens of basketball courts in this district? Why does flood control spending spike here?”
Tordecilla recalls that when he posted the Budget Bot on Facebook, the post was shared thousands of times, with ordinary citizens, NGOs, and outlets like Rappler and PCIJ picking up on the anomalies spotted through the chatbot. “The AI is going to be the easy part; having access to that data is where the gap would be,” Tordecilla explains. With his tool, ordinary people posted their discoveries online, NGOs used the tool to cross-check government claims, and reporters followed up on anomalies citizens spotted.
But despite these experiments and successes, Asia’s data journalism still operates under severe structural constraints. Yolanda Jinxin Ma, who teaches at Hong Kong University and co-founded Data Journalism China in 2014 to train Chinese journalists in data skills, says the problem isn’t a lack of skill: “One of the biggest challenges is not the skillset of the journalists, but the environment — in many countries in Asia, data availability was, and probably still is, a big challenge,” she says.
In China, journalists have had to turn to “alternative data practices,” such as scraping, crowdsourcing, or using satellite images to replace the absence of official open data. Ma’s teaching at Hong Kong University now focuses on AI and innovation, but with a caveat: “Human insights and judgement can and should not be replaced by AI. One should not expect to ask AI, ‘What is the story from the data?’ — rather, journalists need to find the stories, and then get AI to help them with some dirty data work.”
She points to projects like Mapping Makoko, which trained a Lagos slum community to use drones and open data to map itself into existence, as a model for Asia. For her, the future lies in cross-border collaboration: “Technology is going cross-border, so should the stories that are worth pursuing.”
The Bigger Picture
What unites these voices — Salve in Mumbai, Rebelo in Oxford and Mumbai, Loh in Singapore, Duangklad in Bangkok, Tordecilla in Manila, and Ma in Hong Kong — is a refusal to let numbers remain abstract. Whether through watchdog reporting, design, teaching, or experimentation, they are turning data into a lived experience.
For Prachi Salve of IndiaSpend, the absence of reliable records has consequences beyond statistics. “When the Census is delayed, it impacts other datasets too, and excludes millions from welfare schemes such as the Food Security Act, as the number of beneficiaries are calculated based on population data.” Without the data, entire communities become invisible, she adds.
Karen Rebelo, deputy editor at Boom Live, warns that new blind spots are emerging. “Algorithms employed in social welfare schemes – that range from subsidized food, daily wages, pensions to disability allowances — have resulted in unfair exclusions, denied rations, delayed wages. Investigating them is crucial,” she adds.
Patchar Duangklad of Punch Up sees the gap not only in access but in perception: “Charts still feel intimidating to many people. The challenge is to make data part of everyday life less like homework, more like conversation.”
And there is optimism, too. “When citizens can chat with a budget or inspect a dataset themselves, they stop being passive readers. They become co-investigators,” says Jaemark Tordecilla. But for Yolanda Jinxin Ma of Data Journalism China, the promise of new tools must come with a warning: “My teaching at Hong Kong University now focuses on AI and innovation, but with a caveat — we emphasize that these tools must serve reporting, not dictate it.”
 Rachel Chitra has covered South Asia and Southeast Asia for outlets like TechinAsia, Reuters, and Khmer Times, among others. She’s primarily a financial journalist with a passion for using data to tell stories. In her Reuters 2024 fellowship, she wrote a paper on alternative methods to get data titled, “Covering Hate Crimes and Violence When Government Sources Fail.”
Illustration: Nyuk was born in 2000 in South Korea. He is currently studying at the Department of Applied Art Education at Hanyang University in Seoul, where he also works as an illustrator. Since the exhibition at Hidden Place in 2021, he has participated in various illustration exhibitions. He is mainly interested in hand drawing, which represents the value of his art world.
Introduction to Investigative Journalism: Data Journalism
Harnessing the Power of Global Forest Watch for Data-Driven Reporting on Land Cover Change
Tipsheet for Using Ocean Data in Your Investigations
Unlocking the Secrets of Algorithms: Q & A with Investigative Data Journalist Leon Yin

Sigma Awards: 10 Lessons for Data Journalists Around the World

How Middle Eastern Data Outlets Use Data to Challenge Narratives and Advance Accountability

‘A Quest for Evidence’: What Drew Leading Women Data Journalists to the Field

How to Investigate When the State Conceals Data: Lessons from Belarus

This work is licensed under a Creative Commons Attribution-NoDerivatives 4.0 International License
Republish our articles for free, online or in print, under a Creative Commons license.
Republish this article
This work is licensed under a Creative Commons Attribution-NoDerivatives 4.0 International License
Read Next
Data Journalism News & Analysis
Sigma Awards: 10 Lessons for Data Journalists Around the World
The Sigma Awards celebrate the best in data journalism from around the world. Speaking at the Perugia International Journalism Festival, three of the founders of the award highlighted the best projects of recent years and pointed to what journalists can learn from these data stories.
Data Journalism MENA Focus Week
How Middle Eastern Data Outlets Use Data to Challenge Narratives and Advance Accountability
Data journalism in the Middle East has been driven by organizations that have produced collaborations and projects that combine innovative techniques with nuanced local knowledge.
Data Journalism News & Analysis
‘A Quest for Evidence’: What Drew Leading Women Data Journalists to the Field
For International Women’s Day we spoke to data journalists from Argentina, Kenya, Sweden, and Turkey to find out why they chose this path and what challenges still remain.
Data Journalism Getting the Story Out
How to Investigate When the State Conceals Data: Lessons from Belarus
Belarusian journalist Alina Yanchur shared the investigative methods adopted by those who have to work without access to state-published information.