Image: Screenshot
Turning Dead-Ends Into Breakthroughs Using Visual Investigation Techniques
Read this article in


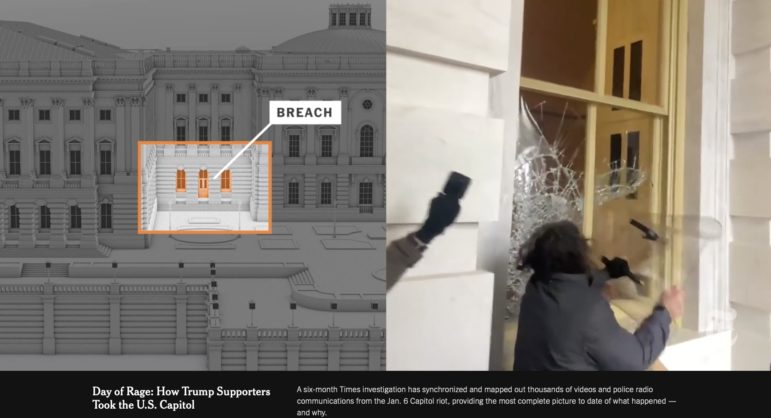
The New York Times spent six months compiling online images and video to show how the US Capitol insurrection was plotted by supporters of then-president Donald Trump and fueled by his rhetoric. Image: Screenshot
There seemed to be too little video evidence available for reporters to dig deeply into the police killing of a young African American woman, Breonna Taylor, inside her home in 2020. None of the seven police officers at the scene had worn body cameras, and reporters were barred from accessing the apartment.
Yet the visual investigations team at The New York Times (NYT) was able to tell the story of each of the 32 bullets fired anyway — and show the police officers’ culpability — with detailed 3D reconstructions and a moment-by-moment timeline.

By contrast, there seemed to be too much video evidence of the deadly riot at the US Capitol, on January 6 this year, for reporters to make sense of the attack, with hundreds of hours of livestreams and social media videos shot by rioters, security cameras, and bystanders.
Yet this same, pioneering team tamed this visual mess with new, open source video analysis tools and automated search apps, and tracked dozens of individual characters and their actions before, during, and after the melee. The team revealed that a tool called VideoIndexer.AI was important in dealing with this huge archive.
In an expert panel on the rapidly-emerging field of visual investigations at the 12th Global Investigative Journalism Conference (#GIJC21), three members of that team underscored two points vital to newsrooms this decade: that it is now possible to show exactly who did what, and when, at violent incidents — and that newsrooms don’t need advanced resources or skills to do it.
Malachy Browne, senior producer on the team, emphasized that traditional reporting methods like interviews, research, and data requests remain at the heart of their approach.
“It’s collecting all types of digital evidence — a time stamp, a video clip, a satellite image, a photograph — then organizing that, pulling out any leads and facts, and combining it with traditional reporting to find the truth about an event,” he said.
Browne added that, in a time of misinformation and media mistrust, video forensic projects can build public trust by transparently showing both the events and the reporting process.
Projects by the team in the past year have also explored the botched, lethal US drone strike in Afghanistan and Israeli airstrikes in Gaza that killed 44 people.
One striking revelation from the panel was that traditional investigative roadblocks can now be overcome with imaginative reporting and open source tools.
For instance, when a ship the team was tracking online turned off its transponder and disappeared from the MarineTraffic site, the Times team re-found their target by first identifying the vessel’s physical features on social media and then finding it with low-resolution satellite imagery on SentinelHub. That moment was eventually included in a Times investigation into smuggling called “A Tanker and a Maze of Companies: One Way Illicit Oil Reaches North Korea.”
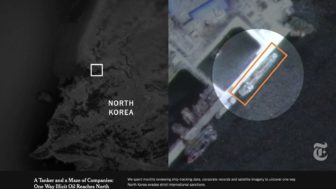
The NYT visual investigations team used marine traffic data and satellite imagery to track illicit oil smuggling on tankers from China to North Korea. Image: Screenshot
Describing the Breonna Taylor investigation, unit reporter Anjali Singhvi said the team found several workarounds when direct access was blocked by law enforcement. For instance, they tracked down a 360-degree layout of an apartment nearly identical to Taylor’s in the same building on a real estate portal. In addition to reviewing many hours of police interviews, her colleague Browne traveled to Louisville, Kentucky, and captured still- and video imagery of the exterior of the apartment. Using publicly released law enforcement data, she said the team digitally modeled the full, muzzle-to-end-point paths of projectiles based on simple trajectory markers — blue plastic tubes — created by police forensic teams at the scene.
“Bullets went through furniture; through pots and pans — five went through a patio door; two went into neighbors’ apartments as well,” noted Singhvi. “We tracked bullets trajectories from ballistics reports and a catalog Malachy built of where the casings fell. The SWAT team video… was also helpful.”
Visual Investigation Tips from The NYT
- Try the VideoIndexer.AI analysis tool for large projects. Browne said this free tool uploads videos efficiently, automatically transcribes them, and then allows you to search that transcript to find points in the footage where a certain word was mentioned. “It doesn’t do facial recognition, but it does do some object recognition — so if it thinks the same person appears at different places, you can scroll and check,” said Browne.
- Dig into clips with video control tools. Try Watch Frame by Frame, which lets you watch a clip in slow motion, or mirror flip or rotate a video.
- Pre-emptively research groups that are likely to be involved in violent incidents. Browne said research into three white supremacist groups prior to January 6 helped the team to track faces through videos shot from several directions — better, in some cases, than facial recognition software.
- Use Twitter lists to organize a story’s characters. Google search other people’s Twitter lists, then copy and merge lists into a list of your own.
- Don’t withhold potential breaking news stories and urgent short clips. Some videos gathered for a longform visual investigation may be too valuable to save for the later story and required immediate publication. Browne said certain key moments included within their 40-minute “Day of Rage” documentary — which took six months to produce — also needed to be released right away due to the public interest.
- Try to recreate scenes using open source 3D tools. One good candidate for this is the free Blender tool.
- Seek partners or stringers with local language skills and cultural knowledge for far-flung investigations. For instance, Muyi Xiao, a visual investigations reporter at the NYT, revealed that local reporters in Asia proved crucial for their North Korean oil smuggling story, partly because there were at least five different spellings for the name of the founder of the central company involved.
- Track ships and their owners with new open source tools. To track ships, check out MarineTraffic, VesselFinder, SentinelHub, Planet Explorer, and Image Hunter. For more specific searches of companies in Asia, try databases like Equasis, World Ship Register, and Vessel Value.
- Make time to browse up-to-date tools dashboards. Look for the forensic solutions you need within the vast Marc Kranat OSINT toolkit.
Additional Resources
The Forensic Methods Reporters Are Using to Reveal Attacks by Security Forces
My Favorite Tools: Malachy Browne
How The New York Times Tracked Public Data to Produce “Killing Khashoggi”

This work is licensed under a Creative Commons Attribution-NoDerivatives 4.0 International License
Republish our articles for free, online or in print, under a Creative Commons license.
Republish this article
This work is licensed under a Creative Commons Attribution-NoDerivatives 4.0 International License
Read Next

GIJC23 Reporting Tools & Tips
How Old-School Field Reporting Powers High-Tech Visual Investigations
Forensic visual investigation has rapidly become a critical method of journalistic inquiry, thanks to new technologies, innovative skills, and the global ubiquity of social media imagery.

Methodology Reporting Tools & Tips
7 Tips for Reporting on the Local Impacts of International Trade
Clark Merrefield, from The Journalist’s Resource, shares seven tips on how local journalists can better investigate global trade and its impact on their communities.

Reporting Tools & Tips Safety & Security
The Latest on Coping with Internet Shutdowns and Online Censorship
The National Press Club recently hosted a panel of cybersecurity and digital experts to discuss the latest in government internet shutdowns and online censorship — and how journalists can work around these challenges.

News & Analysis Reporting Tools & Tips
Gauging the Impact of Your Journalism
Is measuring reach, attention, and engagement the same as measuring the impact of your journalism? The model and technology are not yet there to measure the real impact of a story on behavior and policy.