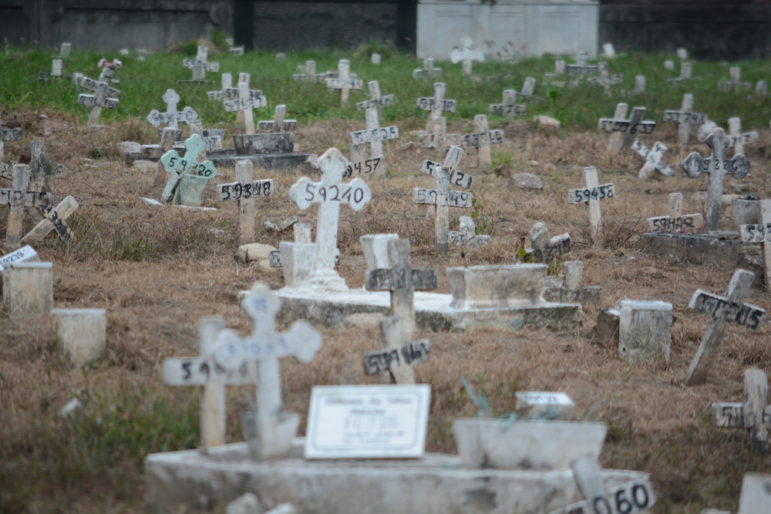
Investigative journalists in Brazil have uncovered government mismanagement and corruption in dealing with the COVID-19 pandemic. Image: Jorge Hely Veiga, Shutterstock
5 Post-Pandemic Data Story Ideas for Journalists
Read this article in
As vaccination drives gain pace in many parts of the world or move into the booster phase, we are starting to see the beginning of what we hope will be the end of the COVID-19 pandemic. While some countries are still struggling with their latest wave of infections, others have made plans to reopen their economies, education, and other social sectors.
Since the start of the pandemic in early 2020, data-driven reporting on COVID-19 has gone through several phases. Initially, most of it focused on the pandemic itself: the progress and trends of infections. Later, it was about vaccination rates and efficacy.
That is not all you can do with data. Moving into the second part of the pandemic, data can measure the changes and effects of the virus on our world, shed light on flaws within our current systems, and suggest long-term solutions to prevent or mitigate the next disaster.
This was the focus in the COVID-19 and Public Health Data Storytelling workshop series supported by the Google News Initiative and organized by WAN-IFRA APAC (World Association of News Publishers, Asia Pacific Committee) in June 2021.
In three online sessions, I shared with 283 journalists from 46 media publications across Southeast Asia the principles and practical skills in harnessing the power of data to strengthen their reporting on both the pandemic and related public health issues.
Collect and Monitor Data

Nigerian news site Dataphyte used data to expose how the government mismanaged purchases of N95 masks during the COVID-19 pandemic. Image: Screenshot
One of the key takeaways from my workshop is that journalists need to start collecting and monitoring data for post-pandemic investigations.
In many Asian countries where governments only share data on an annual basis, the release of 2020 data has begun. This allows journalists to quantify and measure the impact of the pandemic and answer important questions — like, who enriched themselves by taking advantage of the pandemic?
For example, many governments were given leeway to make pandemic-related purchases and approve policies. However, journalists in Brazil have exposed irregularities and corruption in the purchase of respirators by the state through data collection and analysis. Similar data-driven investigations in Nigeria found that health supplies used to fight COVID-19 were bought at inflated prices.
Measure Impact on Vulnerable Groups
Data can also help journalists monitor the recovery of vulnerable and underprivileged communities that were hit hardest during the pandemic and the effectiveness of various government aid and recovery programs. Some questions that can lead to quality reporting include:
- What happened to the poorest families in our society, six to 12 months after the pandemic?
- What happened to children who lost their parents to the virus?
- Did government assistance reach those who really need it?
- Did someone take advantage of pandemic policies or programs?
Track Inequality
If the pandemic has widened the gap between classes and amplified the inequality in your country, it is very likely that the COVID-19 vaccine rollout will follow the same path.
This is another opportunity for journalists to expose wrongdoing, and call for amends, using data. One good example is a report by The Local — a Toronto-based independent news magazine — that used maps to show how Ontario’s vaccine strategy has missed the most vulnerable areas of Toronto.
Prepare for Disease X
Another question explored during the workshops was the prevention of, and preparation for, the next outbreak. Although the art of prediction does not usually fall within the expertise of journalists, they can still inform the public by monitoring indicators linked to outbreaks — for example, wildlife trade and deforestation.
Put New Data Skills to Immediate Use
In addition to story ideas and data reporting recipes, the workshop introduced participants to the best practices and online tools for data visualization.
Some participants put their newly acquired skills into use almost immediately. Among them were journalists from Malaysian Chinese-language newspaper Sinchew Daily, which used an online visualization tool, Flourish, to create interactive charts that illustrate the latest Covid-19 situation in Malaysia in a more engaging manner.
This story was originally published on the WAN-IFRA website. It is republished here with permission. Author Kuek Ser Kuang Keng will be speaking at the Global Investigative Journalism Conference this Nov. 2, on Data Journalism: Where We’ve Been, Where We’re Headed.
Additional Resources
How the COVID-19 Pandemic Has Shaped Data Journalism
Tips on Making FOIA Requests About COVID-19
How Data Journalists Exposed the Real COVID-19 Death Toll in Brazil
Tips on Where to Get Coronavirus Data — and the Tools to Analyze It

Kuek Ser Kuang Keng is an award-winning digital journalist based in Kuala Lumpur, Malaysia. He has been profiled in GIJN and is the founder of Data-N, a training program that helps journalists to integrate data journalism into daily reporting. Data-N has helped publications like Foreign Policy, BBC World Service, Mediacorp, and Malaysiakini to enhance their storytelling with data, visual, and interactive components.

Investigating Latin America’s Global Reach Of Illicit Activities

The Investigative Agenda for Climate Change Journalism

GIJC23 – Measuring Impact
GIJC23 – What Does AI Have to Do with Investigative Journalism? Everything!

Following the Digital Trail: How East African Journalists Investigate Corruption through Procurement Data
Elections Under Attack, Shadow Aircraft Fleet, National Park Land Grabs: 2025’s Best Investigative Stories from Sub-Saharan Africa
‘Ghost’ Prisoners, Missing Children, Anti-Corruption Wiretaps: 2025’s Best Investigative Stories from Ukraine

The Daphne Caruana Galizia Foundation: Continuing the Legacy of a Trailblazing Journalist

This work is licensed under a Creative Commons Attribution-NoDerivatives 4.0 International License
Republish our articles for free, online or in print, under a Creative Commons license.
Republish this article
This work is licensed under a Creative Commons Attribution-NoDerivatives 4.0 International License
Read Next
News & Analysis
Following the Digital Trail: How East African Journalists Investigate Corruption through Procurement Data
Journalists in Kenya, Uganda, South Sudan, and surrounding countries are using procurement data to reveal corruption, and can offer lessons for journalists around the world.
Editor's Picks News & Analysis
Elections Under Attack, Shadow Aircraft Fleet, National Park Land Grabs: 2025’s Best Investigative Stories from Sub-Saharan Africa
In 2025, journalists across Africa have courageously reported on illegal activities — and their impact — long after they’ve occurred, and despite attempts to bury this information.
Editor's Picks News & Analysis
‘Ghost’ Prisoners, Missing Children, Anti-Corruption Wiretaps: 2025’s Best Investigative Stories from Ukraine
Despite domestic threats to press freedom and power cuts and sleepless nights from Russian attacks, Ukrainian independent journalists continue their work with depth and skill.
Member Profiles News & Analysis
The Daphne Caruana Galizia Foundation: Continuing the Legacy of a Trailblazing Journalist
In the aftermath of a car bombing that killed one of Malta’s leading investigative reporters, her family set up an organization to fight for justice and ensure her legacy lives on.