Register for #GIJC25
November 20, 2025 • 09:00
-
day
days
-
hour
hours
-
min
mins
-
sec
secs

Accessibility Settings

color options

monochrome muted color dark

reading tools

isolation ruler

Posts

30 posts

Data Journalism

Data Journalism Top 10: Pace of Global COVID-19 Deaths, Who Can Work from Home, Visualizations for the Colorblind, Skin Tone and Sports

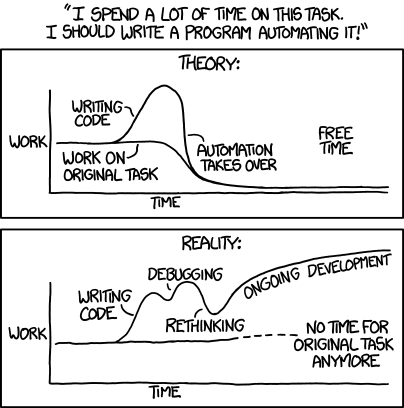
It is hard to comprehend the true impact of COVID-19 around the world. Our NodeXL #ddj mapping from June 29 to July 5 finds Reuters trying to visualize the alarming rate of deaths related to the coronavirus pandemic, Datawrapper examining which employees can actually afford to work from home, and data journalist Carmen Aguilar García writing about using R programming language and automating repetitive data processes in order to keep up with the demand for pandemic news.

6 Tools and 6 Techniques Reporters Can Use to Unmask the Actors behind COVID-19 Disinformation

With fact checking organizations having already debunked thousands of falsehoods about COVID-19, investigative reporters are turning their focus to the people and the money behind deliberate disinformation surrounding the pandemic. In a series of interviews with GIJN, seven journalists shared the inside story on how they exposed the forces behind the lies, as well as key tips on the tools and techniques that aided their investigations.

Resource

Tips and Strategies: Freelancing during the COVID-19 Pandemic

Freelancing as an investigative journalist is challenging in the best of times, and it has proven even more difficult during the coronavirus pandemic. From managing physical risks to losing work due to the global economic slowdown, the difficulties are unique and the challenges varied. For more on Distribution, Promotion, and Freelancing, see our GIJN Guide. Here […]

Resource

Freelancing Investigative Journalism: How to Pitch

Selling freelance investigative journalism proposals is a lot like selling other stories, but harder. There just aren’t enough media outlets willing to engage in watchdog reporting. For more on Distribution, Promotion, and Freelancing, see our GIJN Guide. And pitching investigations which may have uncertain and controversial outcomes is especially challenging, requiring the establishment of mutual trust. […]

Reporting Tools & Tips

Freelancing During the Pandemic: A Pitching Guide and Free Webinar for Investigative Reporters

Freelancing as an investigative journalist is challenging in the best of times, and more so during a pandemic. GIJN’s latest guide offers broad guidance on pitching, financial support, and networking for freelancers as the COVID-19 crisis continues. Be sure to catch our free webinar — Freelance Investigative Journalism During the Time of COVID — on Thursday July 9 at 9:00 EST as part of GIJN’s Investigating the Pandemic series.

News & Analysis

What We’re Reading: Facebook’s Original Reporting Algorithm, Academic and Journalism Collaborations, and the Race Problem in Europe’s Newsrooms

This week’s Friday 5, where we round up our favorite reads from around the online world in English, includes a recent algorithm change on Facebook’s News Feed that will boost original news stories, lessons learned on an academic and investigative journalism collaboration, and European media’s race problem.

GIJN Webinar — Investigating the Pandemic: Surviving as a Freelance Journalist

In this GIJN webinar, Surviving as a Freelance Journalist, we bring together five senior investigative journalists, four with hard-won years of freelance experience and one who has commissioned and worked with freelancers and independents for decades. They will suggest concrete steps to improve conditions for freelance investigative reporters, and share the best services and resources.

Data Journalism

Data Journalism Top 10: How US Infection Spread, Data Hires, Identity Theft, and Lightning Strikes vs. Lottery Wins

Our NodeXL #ddj mapping from June 22 to 28 finds The New York Times analyzing travel patterns and genetic data to show how the disease spread across the United States, and the impact it has had on nursing homes and elderly care facilities. The Washington Post is responding to the increasing importance of visual data communication by expanding its data and graphics team, and the Pulitzer Center is calling for data journalism story proposals.

News & Analysis

How The New York Times Visualized Global Trends in White Extremist Attacks

Last year The New York Times published an interactive article on white extremist killings from New Zealand to Norway to the United States. Using maps and a timeline to plot the data, the project revealed the troubling frequency and, in some cases, strange connections between the events. Here graphic designer Weiyi Cai explains how they obtained the data for project and the decisions they made about visualizing it.