Français| বাংলা| Русский| العربية
What tools do investigative journalists use in the course of their work? In GIJN’s My Tools series, we ask journalists from around the world to share some of their favorites with our readers.
This week we spoke with Malachy Browne, senior story producer on the Visual Investigations team at The New York Times.

Malachy Browne.
A native of Ireland, Browne became an expert in social media newsgathering and verifying user-generated content through his work at Storyful and Reported.ly. In 2016, he brought these skills over to The New York Times. There, he has become a pioneer in the field of visual investigations, which mixes traditional reporting with digital forensics. This frequently involves recreating crime scenes by using 3D modeling, satellite imagery, and images filmed on cell phones.
Browne has led a number of award-winning investigations, including into journalist Jamal Khashoggi’s murder at the Saudi consulate in Istanbul, chemical attacks in Syria, and the shooting of a young medic in Gaza.
Here are some of Browne’s current favorite tools:
Satellite Imagery
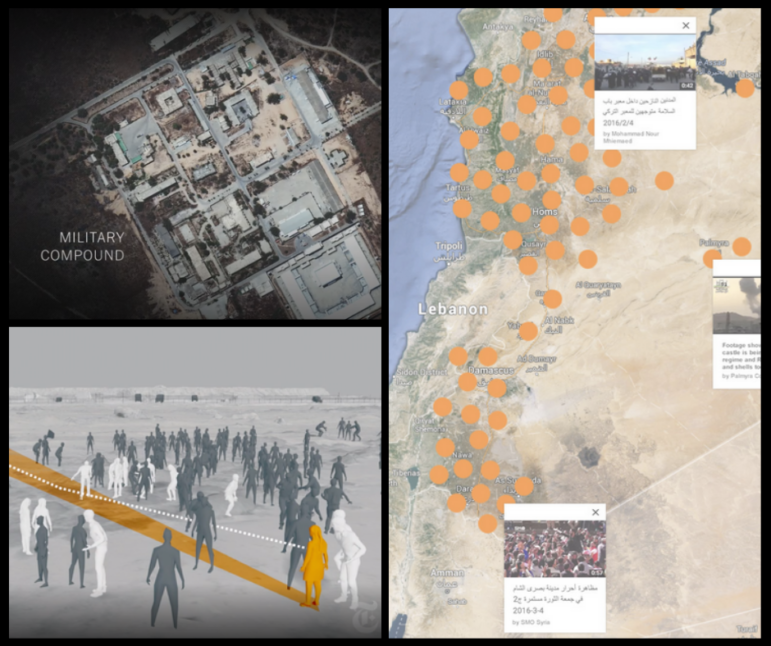
“We use satellite imagery in almost every story that we do. It can reveal details about when there’s changes to topography, but also, for example, if a building is hit in an airstrike, we can confirm that happened within a 24-hour period.
“An example: Dataminr sent us an alert that there was an airstrike on a migrant detention center in Libya. On Twitter, we were starting to get reports of it; Libyan media went there and gave some accounts, but very few images. But then, one of the organizations that runs the center ran a livestream on Facebook that we found. And so, everybody’s worst fear — that this actually did happen — looked like it was legit.
In order to verify the exact location within the migrant detention center [that was hit], we looked for old videos of that particular detention center, called Tajoura, which is a very specific term — not many places are going to be tagged as Tajoura. We found an old video of the center’s opening ceremony on YouTube. So we could see, yeah, this was actually the exact same place that’s blown to smithereens in the pictures that were coming out. Because the old archival video had so much panning across the migrant center, we were able to locate the exact building. Then we talked to a satellite imagery company and got fresh satellite images from there.
“In the course of doing that, we also analyzed a couple of on-camera videos with migrants who were there that were posted overnight. We translated those. Some witnesses were saying: We were working in the weapons depot, cleaning weapons as we usually do, and there was an airstrike on the weapons depot, and so we ran out and we were forced into the migrant lodgings, which is across the way. So by tracking down some of those people, and by tracking down freelance journalists who had worked on the migrant issue, we then were able through WhatsApp to get in touch with witnesses who were there. They sent us photographs of their work in the weapons depot. These people who are trapped in a migrant center, and not allowed to leave it, are also being forced to work by a militia that runs the weapons storage area, which is a legitimate target in the middle of a civil war. And from the satellite imagery, we could indeed see that this was also bombed — so this person’s story was correct.
“There are a number of satellite imagery tools that we use, like TerraServer or Planet Labs. You can search through images; they provide satellite imagery almost every day from almost everywhere. It’s not always very high-definition, but sometimes it can be quite good. Maxar DigitalGlobe provides the highest resolution imagery. These platforms are not hugely expensive, so for a newsroom that is thinking of making better use of satellite imagery, it’s a no-brainer cost-wise.”
Drones + 3D Models
“An experimental approach we took last year was recreating a protest field in Gaza in 3D. The story we were investigating was the shooting death of a medic who was working on the field. It was a chaotic moment, as you’ve seen from footage of those protests — and a bullet rings out and she dies. Our question was: Can we accurately freeze that moment in time and space, and examine what was going on? Who was where? Where were the protesters? Where were the medics? Where were the soldiers? Why was that shot fired, and how did she get hit by it? Was she directly targeted?
“We went through our normal steps of collecting as much video evidence and photographic evidence from the day as possible. We collected 1,300 photos and videos from the original devices with which people filmed there, meaning we had all their metadata; we could organize it.
“Secondly, we went there, and using a high-definition drone, we filmed the entire area. Using a technique called photogrammetry, you can take that footage and create a 3D model of it. We used the photogrammetry software RealityCapture, and we worked with the London-based research agency Forensic Architecture to work on the 3D model in Blender, which is an open-source program.
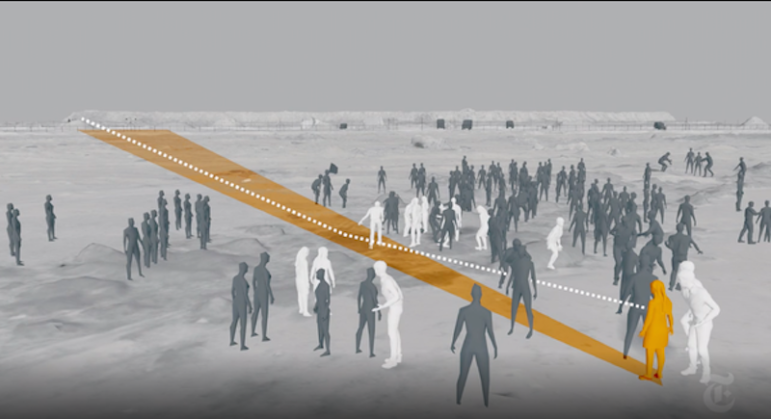
3D model of the bullet’s path. Image: Courtesy Malachy Browne
“Using the footage that we had from the day itself, we just sketched in some of the details that the drone didn’t pick up. We placed the snipers themselves, army jeeps, the fence, the coils of barbed wire before the fence… Then, within that model, it was so precise that we were able to slot in and calculate where the cameras were rolling at the time by looking at objects in the distance, like the fence or the tower or tufts of grass, and line up those cameras in the model.
“Imagine us retracing the paths of the cameras, and freezing them at that critical moment when you hear the shot ring out from six different angles — and that allows us to analyze everything, measure where people were, and ultimately ask the question: Was that gunshot justified? And was the violence such that there was an immediate threat to life at the other side of the boundary fence with Israel? And our conclusion was that it wasn’t. Legal experts and others that we spoke to talked of it being a potential war crime. [The 3D model] allowed us to get into really specific details about the minute that it happened, and how and when it happened. So when we’re interviewing the Israeli authorities about it, we have very specific details. We can match those details with what they say was going on at the time, and present the truth of what happened.”
SAM Desk
“One of the tools we use a lot for newsgathering or content-gathering is SAM Desk. It’s a paid-for tool that allows you to search for certain keywords across multiple social media platforms at once, and it allows you to filter for videos, pictures, and text. You can turn the results on and off, depending on what you’re looking for. Very often, we’re looking for video content. We might put in a place name or a hashtag or a very specific search term. It’s a bit like TweetDeck — the results come in columns, so you can keep an eye on it.
“It’s also good for monitoring situations. So, for example, the Sudan protests had a particular hashtag, or protests in Venezuela — if there’s a particular story that’s ongoing, you can keep checking it day in and day out. It also allows you, from those search results, to collect tweets or videos or whatever it is into little collections, in which you can do your work on them. You can set tags to say whether it’s verified or unverified — ‘we got content clearance to air this’; you can put in notes from your team; and, depending on the platform, it will automatically archive the footage as well so if it’s later taken offline, it’s there preserved for you.
“It also allows you to search for geolocated content. So you can put a pin on ‘Hamburg,’ and create a circle around it, or draw a map, and say ‘give me everything that’s geotagged from that area.’ And because its search results include snaps from Snapchat, which are almost all geolocated, that can be quite useful.”
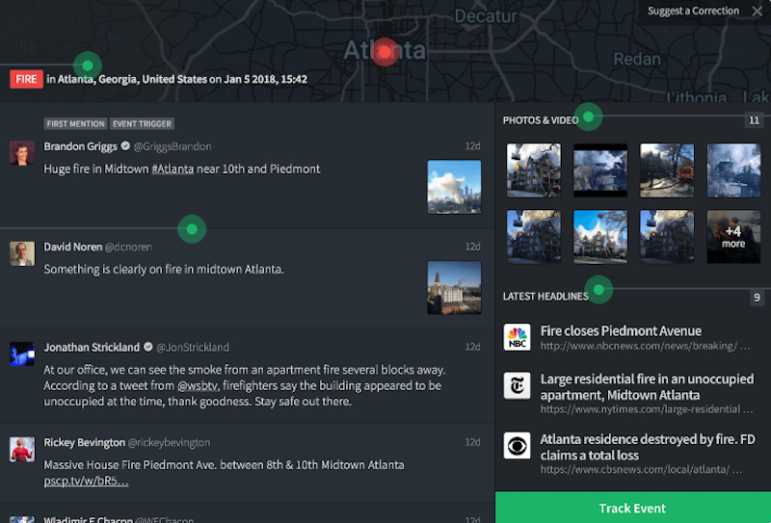
An example of how SAM Desk detects events. Screenshot: SAM Desk
EXIF Data Viewers
“There are a whole bunch of EXIF data viewers. EXIF data is raw information, like the hour, minute, and second that a video or a photograph was taken. Sometimes, it contains GPS data as well, depending on the device. So we’ll use an EXIF data viewer to extract that information, which can help with the verification process.
“EXIF data can be manipulated, so you kind of have to have that health warning — for example, I could go in and change the settings deliberately. So you never rely on one piece of evidence. It’s the same as traditional reporting: who’s your second source, your third source, your fourth source, and what we’re always looking for is corroborating pieces of information.
I myself have never encountered [deliberately manipulated settings]. What I have encountered is when camera settings might inadvertently be wrong, and so you have to be aware that sometimes that might be the case. But EXIF data is quite useful, particularly when there’s a lot of footage of an event and you’re not there but you want to reconstruct a timeline of it so that you have an understanding of what happened — for example, if it escalated into violence, why? So organizing all of the evidence is one of the steps that we take, and EXIF viewers are important for that.”
Montage

Screenshot from Montage.
“Montage is an advanced YouTube search. It allows you to search by date, and also by place if you want — though not a lot of YouTube content is geotagged. But, a little bit like SAM Desk, it also allows you to collect videos into projects and to comment and put tags on them, and at at specific moments in the videos as well. It allows you to organize YouTube content and zoom in on the details as a team. And that’s quite useful, especially if you’re doing historical investigations; so much content from the Arab Spring, for instance, is uploaded onto YouTube.
“It can also be useful just for finding archival reference material. For example, we might want to verify an airstrike location using Google Street View or satellite imagery on Google Earth. But sometimes, the street view isn’t available, or the satellite imagery isn’t good enough. However, if it’s a location that has been used often before, then there’s probably going to be YouTube videos of it out there, so we can use that for those purposes as well.”
InVID
“One last tip: Another tool I often use is the InVID Project’s Chrome extension, which is a one-stop shop for getting YouTube video upload times, doing advanced Twitter search, doing reverse image search, doing video keyframe or thumbnail search, and finding metadata.”
 Gaelle Faure is GIJN’s associate editor. Previously, she worked for France 24, where she specialized in social newsgathering and verification. She has also worked as an editor for News Deeply and reported for Time Magazine.

Reporter’s Tipsheet for Acquiring Free Satellite Images
GIJC23 – Visual Investigations: Reporting Techniques
Remote Sensing and Data Tools for Environmental Investigations
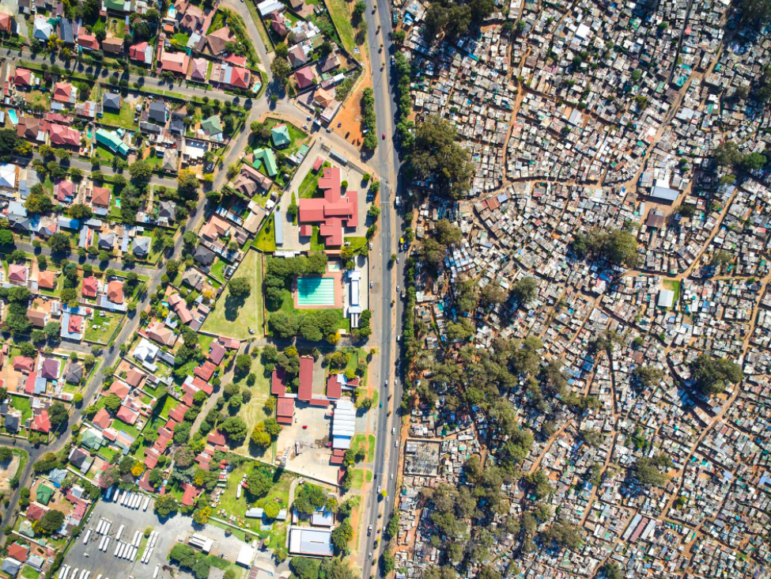
Tips for Reporters Seeking to Reveal the Scale of Inequality
Exiled Journalists’ Tips for Source Protection and Avoiding ‘Propaganda Creep’

Why Any Reporter Can Now Source Free, Quality Satellite Images of Almost Anywhere on Earth

GIJN’s Top Investigative Tools of 2024

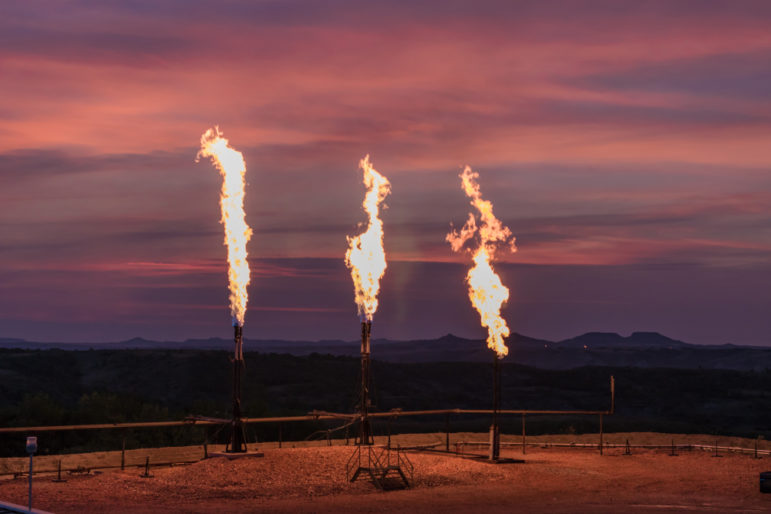
Fossil Fuel Investigations: How to Find Stories Using Oil and Gas Supply Chains

This work is licensed under a Creative Commons Attribution-NoDerivatives 4.0 International License
Republish our articles for free, online or in print, under a Creative Commons license.
Republish this article
This work is licensed under a Creative Commons Attribution-NoDerivatives 4.0 International License
Read Next
Reporting Tools & Tips
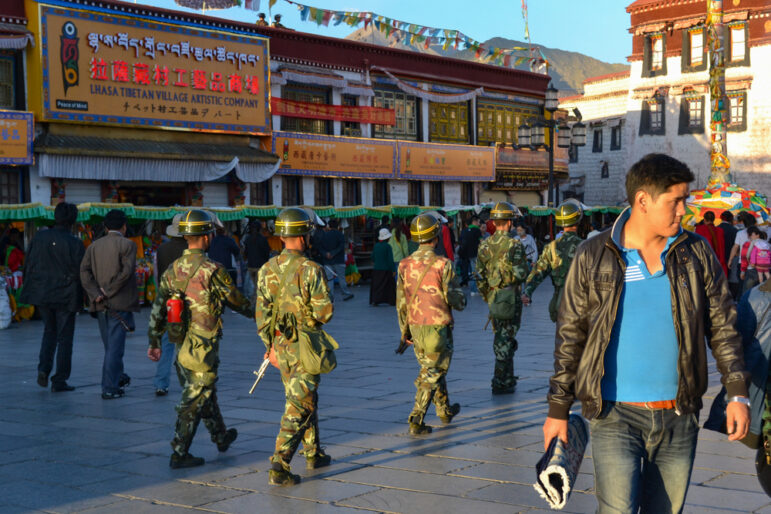
Exiled Journalists’ Tips for Source Protection and Avoiding ‘Propaganda Creep’
Veteran exiled journalists from Iran, Venezuela, and Tibet discuss source protection best practices and publishing survival strategies when reporting on your home country from afar.
Reporting Tools & Tips
Why Any Reporter Can Now Source Free, Quality Satellite Images of Almost Anywhere on Earth
At a recent GIJN webinar, three experts explained how reporters can get regular, free access to high-quality satellite images covering almost anywhere on Earth.
Editor's Picks News & Analysis Reporting Tools & Tips
GIJN’s Top Investigative Tools of 2024
In 2024, new and innovative digital tools provided leads and evidence for accountability stories on every continent.
Climate Reporting Tools & Tips
Fossil Fuel Investigations: How to Find Stories Using Oil and Gas Supply Chains
The oil and gas industry is complex and notoriously opaque. But with new tools, it’s become easier for investigators to dig into this field.