
GIJN’s Data Journalism Top 10: Data Feminism, Blockchain for Investigations, Train Speeds, EU DataViz Conference
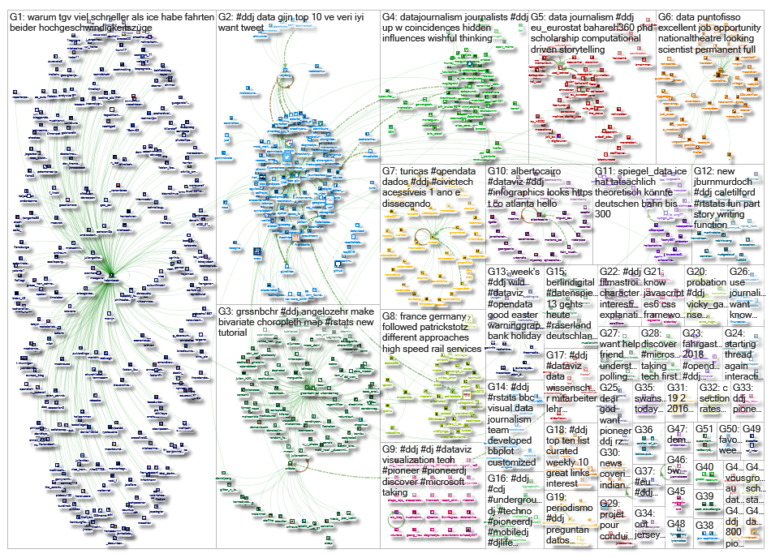
What’s the global data journalism community tweeting about this week? Our NodeXL #ddj mapping from April 15 to 21 finds an informative interactive tool about health by generation by @srfdata, a piece by academic @wsaqaf on how journalism can utilize blockchain for investigations, data visualization teaching materials by @R_Graph_Gallery, and a book draft on data feminism by @kanarinka and @laurenfklein.
How Healthy Is Your Generation?
Inspired by Vox’s “Today’s Teens” story, SRF Data created an interactive tool using health survey data from Switzerland’s Federal Statistical Office. Select your age and gender and the tool will tell you the biggest health problems among those in your age group (with bonus cute gifs!).
Blockchain and Journalism
What can blockchain offer investigative and data journalists? Former journalist turned academic Walid Al-Saqaf argues that all kinds of stories could benefit from using blockchain as a data resource and offers two examples.
Data Viz Teaching Materials
Yan Holtz, author of From Data To Viz, shared his teaching materials online, including an introduction to data visualization, common bad charts and their workarounds, building basic charts with ggplot2 and more.
Data Feminism
Catherine D’Ignazio and Lauren Klein penned a book on data feminism that goes beyond gender, because they believe the term encapsulates much more than that. As they state in the book’s intro: “Data Feminism is a book about power in data science. Because feminism, ultimately, is about power too. It is about who has power and who doesn’t, about the consequences of those power differentials, and how those power differentials can be challenged and changed.”
Tracking Train Timings
Both Germany and France have invested billions in their inter-city high-speed train networks, ICE and TGV, respectively. But as it turns out, the trains run faster on French tracks. Der Spiegel compares the two services and dissects the reasons why German trains are traveling at a slower pace.
Bivariate Maps Tutorial
Last week, we featured an interactive map by Angelo Zehr showing income distribution in different communities in Switzerland. Based on this map, Timo Grossenbacher worked with Zehr to produce a tutorial on creating bivariate thematic maps with R.
https://twitter.com/fhollenbach/status/1119744017405661184
Rulers, Elections, and Irregular Governance Data
The Rulers, Elections, and Irregular Governance (REIGN) dataset describes political conditions in more than 200 countries every month. It includes details on world leaders, political regimes, election outcomes and irregular events such as coups and violent conflicts. Details in Turkish here.
https://twitter.com/OEF_Research/status/1115288621861437440
Biking in London Data
Using the Freedom of Information Act, freelance journalist James O’Malley requested hiring data for London’s Cycle Hire bikes. He mapped out all the available bike stands and using red and green pins, he indicated which stands had more hires than docks, and vice versa.
EU DataViz Conference
The Publications Office of the European Union is organizing an international data visualization conference on Nov. 12, 2019 in Luxembourg. EU DataViz 2019 will discuss data visualization for communication purposes, data exploration, and tools and best practices. Call for contributions are open until June 16, 2019.
https://twitter.com/EU_DataPortal/status/1115958926313443333
Brasil.io Report Card
Software developer Álvaro Justen, creator of data repository Brasil.io, summed up the work and progress of his data platform over the past year. He highlighted two datasets that are particularly relevant for investigative journalists: Brazil’s election data since 1996 and Brazil’s company registry data. He also appealed for project collaborators and institutions that can help with the site’s financial sustainability.
Thanks, once again, to Marc Smith of Connected Action for gathering the links and graphing them. The Top Ten #ddj list is curated weekly.
 Eunice Au is GIJN’s program coordinator. Previously, she was a Malaysia correspondent for Singapore’s The Straits Times, and a journalist at the New Straits Times. She has also written for The Sun, Malaysian Today and Madam Chair.
For a look at Marc Smith’s mapping on #ddj on Twitter, check out this map.

Guide to Mapping Analysis Using QGIS

Basic Data Journalism Tips for Editors

My Favorite Tools: Venezuela’s Lisseth Boon on Design and Data Visualization

Document of the Day: Visual Vocabulary

Turning the Threat to a Distant Glacier into a Local Story Through Data Visualization

Making Trillions Make Sense: How Reuters Visualized the AI Economy

Summer Reading List for Data Journalists: For Those Who Believe in the Power of Storytelling with Numbers

From Data to Storytelling: Concept and Design Tips from the Financial Times’ John Burn-Murdoch

This work is licensed under a Creative Commons Attribution-NoDerivatives 4.0 International License
Republish our articles for free, online or in print, under a Creative Commons license.
Republish this article
This work is licensed under a Creative Commons Attribution-NoDerivatives 4.0 International License
Read Next
Climate Data Journalism
Turning the Threat to a Distant Glacier into a Local Story Through Data Visualization
New York Times climate and environmental graphics reporter Mira Rojanasakul discusses how her team visualized the sea level rise threat from the melting Thwaites Glacier in Antarctica.
Data Journalism
Making Trillions Make Sense: How Reuters Visualized the AI Economy
How do you make a trillion dollars feel real to someone who has never seen that much money? Vineet Khare and Mayank Bhatt faced that very challenge for their data-driven investigation into AI investment.
Data Journalism
Summer Reading List for Data Journalists: For Those Who Believe in the Power of Storytelling with Numbers
Featuring books spanning four continents, these recommended reads provide a global perspective on data journalism.
Data Journalism
From Data to Storytelling: Concept and Design Tips from the Financial Times’ John Burn-Murdoch
The chief data reporter for the Financial Times discusses how he considers the use of text, color, and annotation to aid visual storytelling through charts and graphics.