
GIJN’s Data Journalism Top 10: Donut Holes, Turkish Data and Cop Shootings
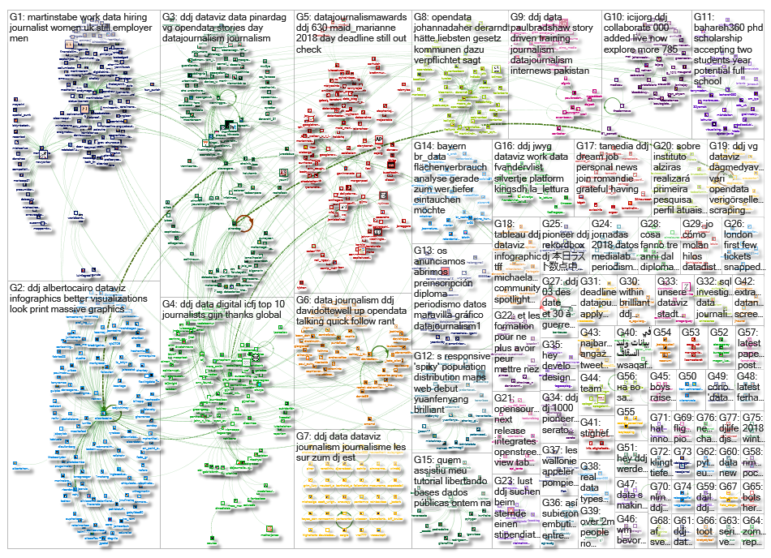
 What’s the global data journalism community tweeting about this week? Our NodeXL #ddj mapping from March 26 to April 1 finds @washingtonpost on fatal police shootings, @decodeurs mapping Europe’s terrorist attacks, @DagmedyaVeri‘s open data resources for Turkey and an undated chart of shrinking donut holes from the @smithsonian archives.
Donut Hole Theory
This chart, part of the Smithsonian’s Sally L Steinberg Collection of Doughnut Ephemera, argues that the size of the donut hole has gradually shrunk over the years. Vox has a whole donut hole debate here.
If I were a *real* professor on the tenure track, this is the type of research I’d be doing. pic.twitter.com/j4tbqKgIlx
— Robert Hernandez (@webjournalist) March 27, 2018
Fatal Shootings Data
The Washington Post is in its fourth year of counting fatal shootings by US police. This year, as of April 2, 10:50 am, 277 people have already been shot and killed by the cops. Explore the data and see the 2015, 2016 and 2017 databases.
In March, American police shot and killed at least 103 people, the second highest total since we started counting and the third highest per-day rate. https://t.co/7GdoE4ji70
— Steven Rich (@dataeditor) April 2, 2018
Terrorist Attacks in Europe
Terrorist attacks have caused at least 2,365 deaths and nearly 8,800 injuries across Europe since 2001. Les Décodeurs mapped the attacks with bubbles directly proportional to the number of people killed and broke down the types of attack.
Two decades of terrorist attacks in Europe, by @decodeurs https://t.co/7D1aIbG7qm (via @GENinnovate) pic.twitter.com/H9LbC8JPN8
— European Data Journalism Network (@EdjNet) March 27, 2018
Double Standard in Hurricane Relief
A Politico investigation shows a persistent double standard in President Trump’s handling of relief efforts for Hurricane Harvey and Hurricane Maria. Nine days after the respective hurricanes, the Federal Emergency Management Agency had approved $141.8 million in individual assistance to Harvey victims, versus just $6.2 million for Maria victims. Politico has these numbers and more.
The neglect of Puerto Rico after Maria seemed obvious. But Politico has the hard numbers. Utterly shameful https://t.co/39HKBfn9vB
— Paul Krugman (@paulkrugman) March 27, 2018
¡Visualización de datos y infografía!
Interactive infographic editor Rafael Höhr curated (in Spanish) a list of essential data visualization resources. His list covers the vocabulary of graphics, tools for visualization and mapping and publications to follow closely for excellent infographics and data visualizations.
Guías, referencias, autores y recursos para crear gráficos. Muy útil /vía @sic https://t.co/jFXeesZjek pic.twitter.com/UM6hnr2LbC
— Alejandro Rost (@alerost) March 27, 2018
UK Women Short-Changed
The Financial Times analyzed data on the UK government’s gender pay gap portal and found that more than three out of four UK companies pay their male staff more than their female staff, and in nine out of 17 sectors in the economy, men earn 10 percent or more on average than women.
Cool chart, depressing data. Great work @ftdata https://t.co/QzInKMcONC pic.twitter.com/aDGqu92axp
— Marie Segger (@MarieSegger) March 28, 2018
Turkish Delight
Veri Kaynagi (Data Source), a database of socio-economic data for Turkey, was recently launched. It compiles public data from official sources and offers them in an easily readable format.
Türkiye’nin Veri Kaynağı Yayında #ddj #vg #Turkey #opendata #dataviz https://t.co/FQGIgcV31x pic.twitter.com/e2wG53301V
— Veri Gazeteciliği Platformu (@DagmedyaVeri) March 27, 2018
Ich bin ein dataset
Need data on Berlin? At daten.berlin.de, you can find 1706 datasets arranged in 22 categories, including information about public administration, budgets, taxes, environment, traffic and elections.
Die Datenjournalisten nutzen https://t.co/oFjhj2CycY von @OpenDataBerlin in ihrer täglichen Arbeit. Wie selbstverständlich. Z.B haben sie den RSS-Feed https://t.co/9gofmvvwo9 aboniert. #opendata und #ddj. Läuft in Berlin #JournoCon18 https://t.co/sUi5TIHfP5
— Thomas Tursics (@tursics) March 24, 2018
Best of UK Data Journalism
Paul Bradshaw rounds up the best of data journalism in the UK in the first few months of this year.
Data journalism in rude health, and we’re really proud to be a part of it – a great article from the excellent @paulbradshaw https://t.co/CxfgATdYc7
— laura_ellis (@laura_ellis) April 2, 2018
Tips for Collaboration
Data journalist Mar Cabra shares 10 useful tips for collaborative data journalism projects, in conjunction with the Global Editors Network’s launch of a Data Journalism Den.
#9 Before you decide on tools to collaborate with, do a threat modeling assessment #ddj https://t.co/wCG8tdj5Wk #PanamaPapers #ParadisePapers
— ICIJ (@ICIJorg) April 3, 2018
Thanks, once again, to Marc Smith of Connected Action for gathering the links and graphing them.
For a look at Marc Smith’s mapping on #ddj on Twitter, check out this map.

Basic Data Journalism Tips for Editors

My Favorite Tools: Venezuela’s Lisseth Boon on Design and Data Visualization

Document of the Day: Visual Vocabulary

How To Create a Data Journalism Team

Turning the Threat to a Distant Glacier into a Local Story Through Data Visualization

Making Trillions Make Sense: How Reuters Visualized the AI Economy

Rewriting the Rules of Digital Verification: How African Investigative Journalists Are Building New Data Models

Summer Reading List for Data Journalists: For Those Who Believe in the Power of Storytelling with Numbers

This work is licensed under a Creative Commons Attribution-NoDerivatives 4.0 International License
Republish our articles for free, online or in print, under a Creative Commons license.
Republish this article
This work is licensed under a Creative Commons Attribution-NoDerivatives 4.0 International License
Read Next
Climate Data Journalism
Turning the Threat to a Distant Glacier into a Local Story Through Data Visualization
New York Times climate and environmental graphics reporter Mira Rojanasakul discusses how her team visualized the sea level rise threat from the melting Thwaites Glacier in Antarctica.
Data Journalism
Making Trillions Make Sense: How Reuters Visualized the AI Economy
How do you make a trillion dollars feel real to someone who has never seen that much money? Vineet Khare and Mayank Bhatt faced that very challenge for their data-driven investigation into AI investment.
Data Journalism
Rewriting the Rules of Digital Verification: How African Investigative Journalists Are Building New Data Models
The global nonprofit WITNESS seeks to address one of the biggest data gaps in the digital verification landscape: the dependence on tools-based methods that lack local knowledge.
Data Journalism
Summer Reading List for Data Journalists: For Those Who Believe in the Power of Storytelling with Numbers
Featuring books spanning four continents, these recommended reads provide a global perspective on data journalism.