
This Week’s Top 10 in Data Journalism
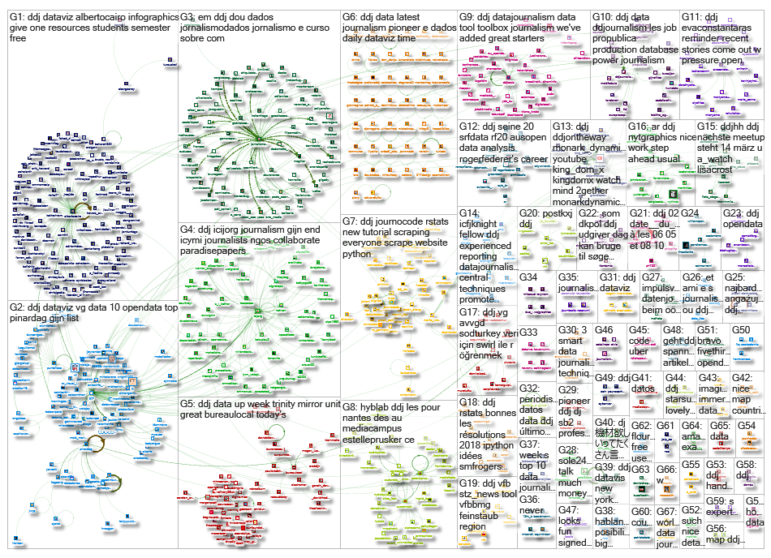
 What’s the global data journalism community tweeting about this week? Our NodeXL #ddj mapping from February 5 to 11 finds @flowingdata‘s tips to visualizing missing or incomplete data, statistics of women’s challenges in journalism by @abraji and @generonumero, and a cool income inequality interactive by @EconomicPolicy.
Visualizing Missing Data
Data often comes incomplete. So what’s a good data journalist to do? Statistician Nathan Yau offers some solutions.
ICYMI, ? guide to seeing what’s NOT there:
“Visualizing Incomplete and Missing Data” by @flowingdata https://t.co/Pf5hZ6XqD2 #dataviz #infovis pic.twitter.com/Aar0zsEw93— Mara Averick (@dataandme) February 11, 2018
Challenges of Women in Journalism
The Brazilian Association of Investigative Journalism (Abraji) and Gênero e Número conducted research in Brazil, with the support of Google News Lab, to investigate the challenges faced by women in journalism.
A Associação Brasileira de Jornalismo Investigativo (Abraji) e a Gênero e Número realizaram uma pesquisa inédita no Brasil para investigar os desafios enfrentados pelas mulheres no exercício da profissão jornalística. Confira! https://t.co/77sNUXD8kh
— Mídia NINJA (@MidiaNINJA) February 9, 2018
Interacting with Income Inequality
Here’s a cool interactive visualization with suggestions on how to fix income inequality in the US through changes in employment, trade, financial regulations and other areas.
Cooles interaktiven Projekt über Ungleichheit und #Armut in den #USA – klickt euch durch: https://t.co/h8DCktQRIf #ddj
— Moritz Wichmann (@Moritz_Wichmann) February 5, 2018
Quick Guide: Data Journalism Tools
Yael de Haan, Renée van der Nat and Winny de Jong have created a quick guide for data journalism practitioners to find tools to analyze and visualize data. Find the right data tool according to what you want to do and your level of experience.
Dabbling in #datajournalism? Our toolbox for beginners in #ddj might help, visit https://t.co/LIxaAnTBzO pic.twitter.com/blbfXrawGV
— Datajournalism.Tools (@ddjtools) February 13, 2018
Call for Gender Data Impact Stories
Data2X, in partnership with Open Data Watch and Devex, has launched the Gender Data Impact: Call for Stories, so statisticians, data scientists, gender equality advocates, citizens and policymakers have the examples they need to advocate for closing gender data gaps and to improve policy for women and girls around the world.
Help link good data to good outcomes: Submit a #GenderDataImpact Story! w @ddjournalism https://t.co/Ean5EER7TI
— Data2X (@Data2X) February 5, 2018
How Open Data Helps Human Rights
Open data helps human rights organizations by providing facts and statistics for education and advocacy. Through data analysis, human rights NGOs can predict future events and trends in human trafficking, slavery, genocide, human rights abuse and more.
How #opendata is helping #humanrights organizations #Turkey #açıkveri #vg #ddj #dataviz https://t.co/ats61zCnA6
— Veri Gazeteciliği Platformu (@DagmedyaVeri) February 5, 2018
Searching for Docs in Deutschland
People living in rural areas have a harder time finding a doctor. Stimme.de visualizes the unequal distribution of doctors in Germany.
Wenn der @dahilzen loslegt, kann man was lernen. Heute, dass Ärzte in der Region #Heilbronn extrem ungleich verteilt sind. Und, dass Scrollys lässig aussehen. https://t.co/gaLP9Qx6IM pic.twitter.com/MMi8K4ObFz
— Daniel Stahl (@stahlniel) February 5, 2018
Security Tools
ICIJ’s Spencer Woodman lists five security tools that are most commonly recommended for reporters, news organizations and their sources.
Top story: 5 digital security tools journalists use to protect their work and s… https://t.co/imlaks3qYn, see more https://t.co/9MiL8cnIgP
— stann2 (@stann2) February 11, 2018
Data Dialogue
Data Intersections is an experimental (and free!) one-day event in Miami, where six experts from journalism, data science, artificial intelligence and the digital humanities will discuss data’s influence and the promises and challenges it poses. Find out more in Alberto Cairo’s blogpost here.
Our FREE #ddj #dataviz #dataScience #digitalHumanities conference is less than 1 month away https://t.co/M5WV4SCxc2 Read more about it and sign up! https://t.co/J3eVehFKeE (and you can use it as an excuse to take a short vacation in Miami; it’s already sunny and warm over here) pic.twitter.com/hy408jpP7d
— Alberto Cairo (@albertocairo) February 5, 2018
Hamburg Data Meetup
Andrea Knabe, Stefan Ruh and Christina Lüdtke will present on German parliamentary data and Lisa Charlotte Rost will talk about the Datawrapper visualization tool at the next Hamburg data journalism/dataviz meetup on March 14. Sign up now.
Das nächste @ddjhh-Meetup steht am 14. März an, u.a. mit @a_watch und @lisacrost: https://t.co/3Q1saCdLwp #ddj #ddjhh
— Marcel Pauly (@marcelpauly) February 5, 2018
Thanks, once again, to Marc Smith of Connected Action for gathering the links and graphing them.


