The Twitterverse Of Donald Trump in 26,234 Tweets

No Coding Required: A Step-by-Step Guide to Scraping Websites With Data Miner

Free, Game-Changing Data Extraction Tools that Require No Coding Skills

Tipsheet on Partnering with Civil Society Organizations and Non-Governmental Organizations

AI Accountability Reporting Guide
We wanted to get a better idea of where President-elect Donald Trump gets his information. So we analyzed everything he has tweeted since he launched his campaign to take a look at the links he has shared and the news sources they came from.
Getting the Data
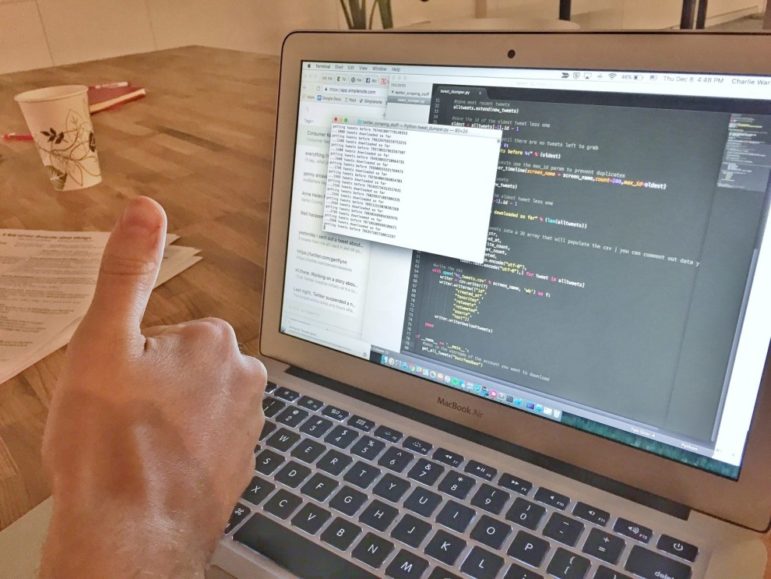
To do this kind of data analysis, we needed an archive of @realDonaldTrump tweets. We started by scraping his feed using Twitter’s API, but Twitter limits the scraping of tweets to roughly 3240 at a time, which represents less than half of his account’s output since he launched his presidential run.
We were able to procure a fuller corpus from developer Brendan Brown’s Trump Twitter Archive, who had found a nifty workaround for that problem by scraping tweets for set time frames and adding them up in the end. Brown’s data, available as csv or json, only went to November 9th, 2016. We completed his data set to Nov 17, 2016 by scraping the remaining tweets directly.
Here’s how:
- Start by getting developer oauth credentials from Twitter: https://apps.twitter.com/
- If you don’t already have Python installed, start by getting Python up and running. Also, if you don’t already have a favorite package manager, you should also make sure you have
pip. - Install tweepy:`
<b>pip install tweepy`</b> - Copy tweet_dumper.py to wherever you keep your scripts. Edit it to include your developer oauth credentials at the top and the username you want to scrape at the bottom. (Thank you to Quartz Things reporter David Yanofsky for the original script.)
- Run it with run `
<b>python scrapername.py`</b>to generate a csv of tweets.
Here is what you’ll find in the resulting CSV:
- id: every tweet has a unique ID that you can use to reconstruct the tweet’s URL. The schema is “https://twitter.com/TWITTERHANDLE/status/IDNUMBER.” For instance, to access Donald Trump’s tweet with ID 805804034309427200, you would head to: https://twitter.com/realDonaldTrump/status/805804034309427200
- created_at: this will give you the date and time the tweet was created. For example 2016-12-01 15:57:15
- favorites: number of times the tweet was favorited — note that if the entry is a retweet, it will not be shown.
- retweet: how often the tweet was retweeted
- retweeted: whether the tweet was a retweet (true) or not (false)
- source: how the tweet was posted, eg. “Twitter for iPhone” or “Twitter Web Client”
- text: the content of the tweet
Parsing the Tweets
 The question we wanted to ask about Trump’s tweets was this: is there anything to learn from the URLs that @realDonaldTrump circulated during his campaign?
For that we needed the actual URLs. In Google Spreadsheets, we used a regular expression to extract strings that started with “http”. We expanded these links using the node.js expand-url module.
- Install dependencies with `
<b>npm install async expand-url`</b> - Copy your URL array into url-expander.js and run it using this command `
<b>node url-expander.js`</b> - Paste the output into a new csv and merge that with your original spreadsheet.
- Use more Google Spreadsheets regex to zero in on the domain names
We added this data back into the larger spreadsheet and stripped the links down to their root URL, again using Spreadsheets regex capabilities. This finally allowed us to group root URLs and count them using pivot tables.
This is by no means the only (or even the best) way to extract a list of domain names from a corpus of tweets (you could always extract all the links programmatically, using Python or MySQL), but it was our strategy given the time and resources we had.
We then modified one of Mike Bostock’s d3.js graphics for our needs, styled it to fit the BuzzFeed look-and-feel, and allowed our audience to explore the data using a zoom function. If you want to learn more about D3, O’Reilly has an excellent primer.
Public Figures and Social Data
The biggest question this project brought up was that of the importance of social media for public figures.
When a president-elect makes official announcements on Twitter, do they become important public documents? If yes, should we be able to access an archive of them tweets, beyond what a private company has decided to provide? Shoot me your thoughts at lam.vo@buzzfeed.com.
 This article first appeared on Buzzfeed News and is reproduced here with the author’s permission. It was also cross-posted on Source.
Lam Thuy Vo is an Open Lab Fellow for BuzzFeed News and is based in San Francisco. She is a German-born Vietnamese reporter who codes, writes, and creates visuals.
No Coding Required: A Step-by-Step Guide to Scraping Websites With Data Miner
Free, Game-Changing Data Extraction Tools that Require No Coding Skills
Tipsheet on Partnering with Civil Society Organizations and Non-Governmental Organizations
AI Accountability Reporting Guide
No Coding Required: A Step-by-Step Guide to Scraping Websites With Data Miner

Data Journalism Top 10: Measuring Mask Use, Parental Interruptions, Childbirth Woes, India’s Low Death Rate

Data Journalism Top 10: COVID-19 Racial Inequity, Cash for the Connected, Africa’s Silent Epidemic, Amazon Safety

This Week’s Top 10 in Data Journalism

This work is licensed under a Creative Commons Attribution-NoDerivatives 4.0 International License
Republish our articles for free, online or in print, under a Creative Commons license.
Republish this article
This work is licensed under a Creative Commons Attribution-NoDerivatives 4.0 International License
Read Next
Guides Tipsheet Data Journalism GIJC23
No Coding Required: A Step-by-Step Guide to Scraping Websites With Data Miner
Knowing where to look for data — and accessing it via scraping data from websites — can be a powerful force multiplier for investigative journalists.
Data Journalism
Data Journalism Top 10: Measuring Mask Use, Parental Interruptions, Childbirth Woes, India’s Low Death Rate
How widespread is mask use in your country? Our NodeXL #ddj mapping from July 13 to 19 finds The New York Times mapping the odds of people encountering other mask wearers in the United States, two university professors quantifying the number of interruptions a parent suffers on average every hour while working from home, the Committee to Protect Journalists talking to data journalists about the struggles of reporting on COVID-19, and openDemocracy documenting cases of mistreatment of women in labor around the world since the pandemic started.
Data Journalism
Data Journalism Top 10: COVID-19 Racial Inequity, Cash for the Connected, Africa’s Silent Epidemic, Amazon Safety
The coronavirus pandemic has upended the lives of people around the world, but some communities are especially hard hit. Our NodeXL #ddj mapping from July 6 to 12 finds The New York Times analyzing data that reveals Black and Latino people have been disproportionately affected by COVID-19, The Washington Post highlighting that business relief funds for the pandemic have gone to the rich and well-connected, and Bloomberg looking at more than 120 US businesses that say the coronavirus helped force them into bankruptcy.
Data Journalism
This Week’s Top 10 in Data Journalism
What’s the global data journalism community tweeting about this week? Our NodeXL #ddj mapping from February 12 to 18 finds @MattLWilliams discussing the ethics of publishing Twitter content, @MaryJoWebster explaining several common “dirty data” problems and @MediaShiftOrg showing examples of the powerful impact of small data teams in newsrooms.