
Image: Screenshot, The Washington Post
Inside Epstein’s Elite Friend Network, Visualizing Venezuela’s Oil Reserves, and Climate Change’s Impact on Winter Olympics
Over the past few weeks, journalists have been unpacking the latest US Department of Justice (DOJ) release of files relating to Jeffrey Epstein. A Wall Street Journal piece uncovered Epstein’s ties with prominent figures such as veteran British politician Peter Mandelson, entrepreneur Richard Branson, and former Trump strategist Steve Bannon, and how they continued to correspond with Epstein and even offered him public relations and legal support after his 2008 conviction. Our roundup of the Top 10 in Data Journalism considers stories from January 28 to February 10, with the Minnesota Star Tribune mapping ICE detainee transfers to deportation hubs, an Al Jazeera visual explainer on the amount of oil Venezuela has, and the South China Morning Post’s look at the cultural significance of the Year of the Fire Horse.
Emails Show Global Elites’ Support for Jeffrey Epstein
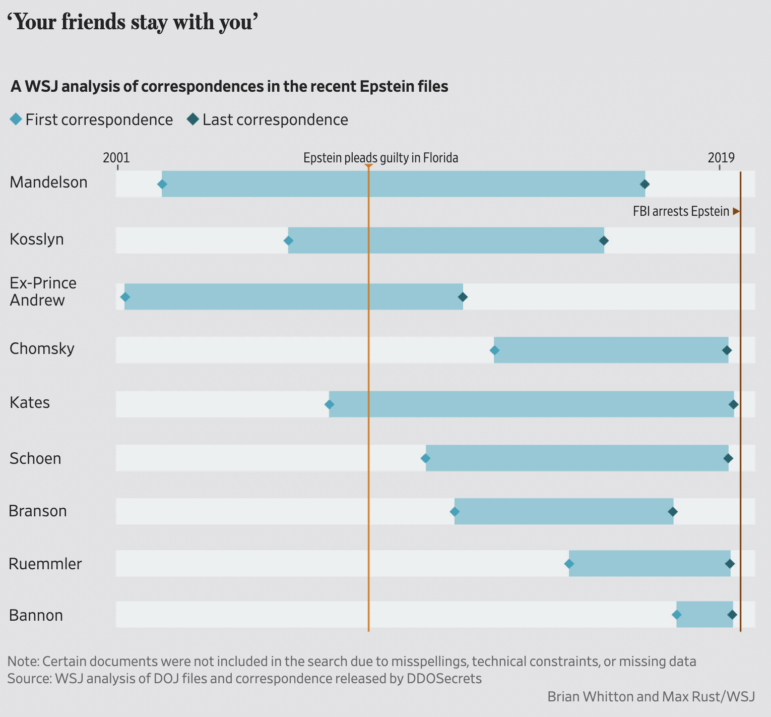
Image: Screenshot, The Wall Street Journal
The latest tranche of the Epstein files released by the US Department of Justice contains millions of pages of documents and newly released emails. The Wall Street Journal analyzed correspondence from high-profile individuals, including British politician Peter Mandelson, intellectual Noam Chomsky, and Virgin Group founder Richard Branson, mapping the first and last correspondence dates between each figure and Epstein in a Gantt chart. The analysis revealed that prominent people in politics, business, and academia didn’t just maintain ties with Epstein after his 2008 conviction for soliciting a minor for prostitution; they actively reassured him, cast him as a victim, and offered advice on rehabilitating his image. The WSJ documented exchanges spanning from 2006 through 2019, including Peter Mandelson’s 2008 message declaring “your friends stay with you,” Richard Branson’s 2013 public-relations strategy suggesting Bill Gates could defend Epstein publicly, and Steve Bannon’s 2018-2019 messages characterizing media scrutiny as a “sophisticated op.”
How ICE Moves Detainees Around the US
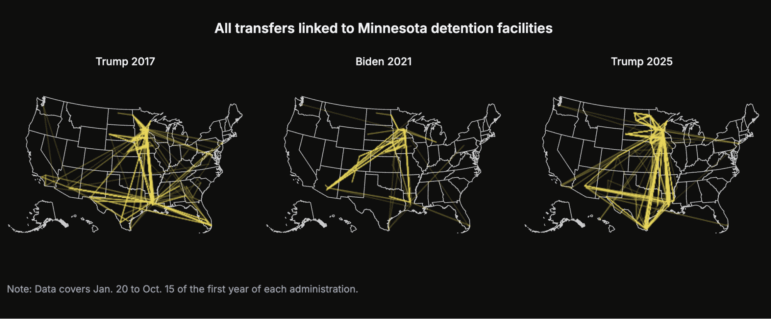
Image: Screenshot, Minnesota Star Tribune
Using Immigration and Customs Enforcement (ICE) detention data obtained via FOIA requests to the Deportation Data Project, the Minnesota Star Tribune analyzed the movements of more than 250,000 immigrants detained nationwide from January 20 to mid-October 2025. The analysis tracked individual detention paths using anonymized identifiers, mapping each person’s journey from their first lockup to their last recorded location, with facility coordinates from the Vera Institute of Justice. The data showed ICE recorded nearly 220,000 arrests between January 20 and October 15, resulting in more than 630,000 jail bookings. An animated flow map visualized how detainees were funneled from regional facilities into major deportation hubs, with many transferred hundreds of miles from where they were initially detained. In 2025, more than 2,700 immigrants passed through Minnesota detention facilities and were transferred nearly 8,000 times during this period. The reporting included case studies tracking individuals without criminal records who were moved between facilities, and incorporated flight-tracking data from Minneapolis-St. Paul International Airport showing that deportation flights increased from roughly one per week last winter to as many as three per day now, according to a professional airplane tracker.
Hosting the Winter Olympics is Getting Harder
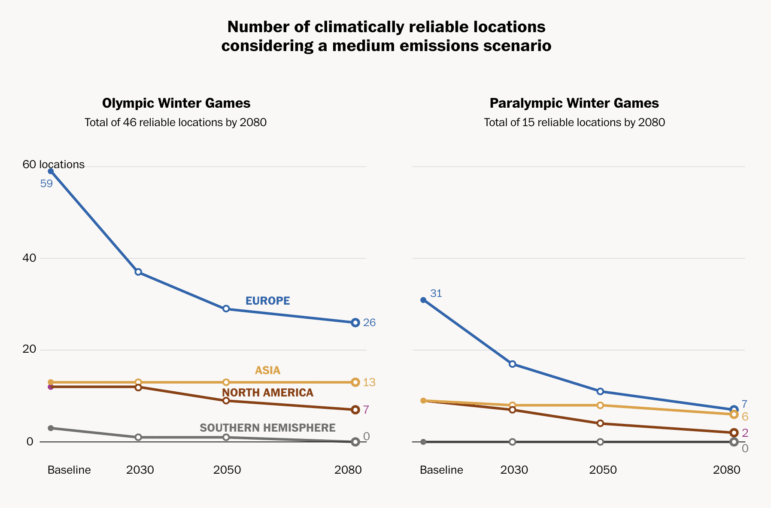
Image: Screenshot, The Washington Post
The 2026 Winter Olympics are currently underway in Milan and Cortina d’Ampezzo, Italy. The Washington Post examined how climate change could affect 93 cities that already have the infrastructure to host the Winter Olympics, projecting how reliable winter conditions would be at each location through 2080. The analysis showed that under a medium emissions scenario, the number of climate-reliable host locations — which are locations that can deliver snowpack in the right conditions 90% of the time and reach daily freezing temperatures to produce machine-made snow — will decline from 83 sites at baseline (1980-2010) to 58 by 2030, 50 by the 2050s and 42 by the 2080s, with Europe experiencing the largest decline due to lower elevation venues. Temperature projections across all 93 locations showed warming trajectories ranging from 0.7–7.9 degrees Celsius (1.3–14.2 degrees Fahrenheit) by 2080, depending on emissions scenarios. The Post visualized historical reliance on machine-made snow at recent Games, showing Beijing 2022 used 100% artificial snow while Milan-Cortina 2026 expects 85-100% usage across venues. The analysis highlighted that Paralympic Winter Games face even steeper challenges, with only 15 climate-reliable locations remaining by 2080 compared to 46 for the Olympic Games.
Challenging AI-Generated Videos
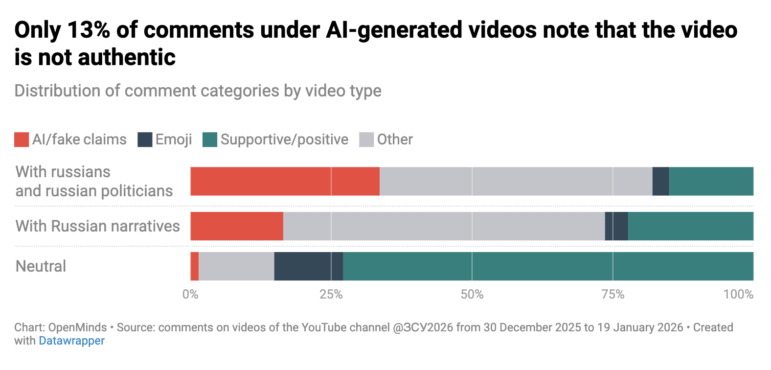
Image: Screenshot, OpenMinds
OpenMinds, a technology company that focuses on information warfare, analyzed 18,522 comments from approximately 12,000 users on what they described as a pro-Russian YouTube channel targeting Ukrainian audiences with AI-generated videos. Its analysis revealed that viewers rarely challenged AI-generated content — only 13% questioned the authenticity of videos, despite a disclaimer in the channel description stating the content was AI-generated. The channel, created on December 30, 2025, reached 46,000 subscribers and generated over 26 million views across 81 videos within three weeks. All videos and comments were manually reviewed using a rule-based classification framework, and gender was inferred from usernames via GPT-4o-mini, a new model from OpenAI. The data showed comments calling out the videos as fake rarely achieved visibility, with debunking attempts buried in reply threads. The analysis found women posted 61% of comments and were significantly more likely to express gratitude toward Ukrainian soldiers depicted in the videos. The findings suggest AI-generated war narratives remain persuasive even when explicitly labeled.
Visualizing Venezuela’s Oil

Image: Screenshot, AJ Labs/Al Jazeera
Washington is selling large amounts of Venezuelan oil following US forces’ abduction of President Nicolas Maduro last month. With 303 billion barrels, Venezuela holds the world’s largest proven oil reserves, but the scale of that figure is difficult to grasp. Using 3D models and spatial comparisons, AJ Labs visualized the volume in terms accessible to general audiences. The analysis showed that Venezuela’s reserves could fill Michigan Stadium — the largest football arena in the US — 64,000 times over. Drawing on data from the US Energy Information Administration (EIA), the piece also calculated how far a single barrel of oil could power a car, how long Venezuela’s reserves might last under various consumption scenarios, and estimated the total monetary value of the country’s oil wealth at different spot prices. (Editor’s Note: This column’s author also works for Al Jazeera, so this selection was independently reviewed and approved by GIJN’s editorial team.)
Welcoming the Year of the Horse
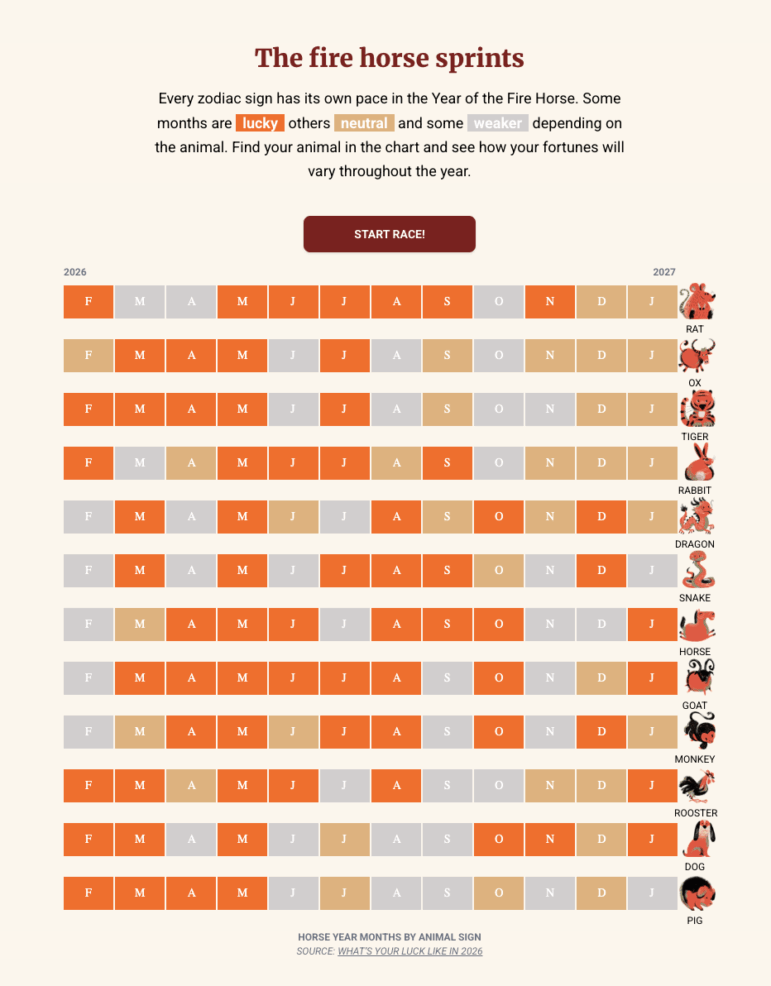
Image: Screenshot, South China Morning Post
As February 17 marks the start of the Chinese New Year and the year of the horse — traditionally associated with volatility and opportunity — the team at SCMP set out to explain its significance in Chinese culture. The Chinese zodiac operates on a 12-year cycle, with each year represented by a specific animal such as the snake or dog. The analysis profiled notable figures born in the year of the horse (often characterized by quick wit), and included an interactive feature allowing readers to identify their own zodiac sign. Using a bar chart race, the piece visualized how fortunes vary by the 12 zodiac animals across the months of the Fire Horse year, showing some months bring luck, others neutral conditions, and some weaker periods.
Climate Vulnerability and Social Protection
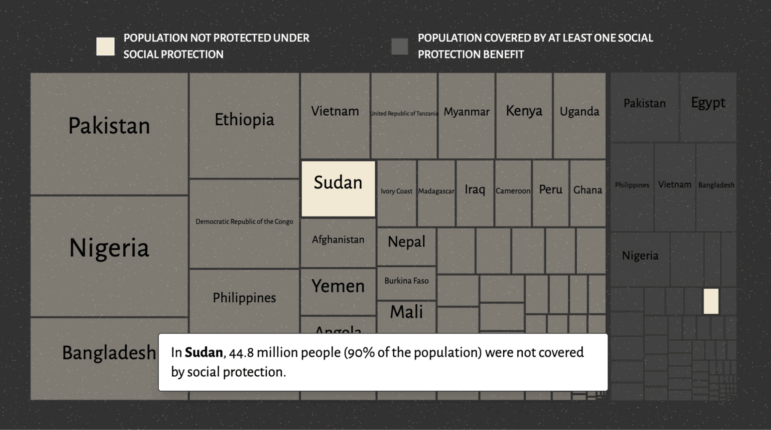
Image: Screenshot, Deutsche Gesellschaft für Internationale Zusammenarbeit (GIZ) / Revisual Labs
The Deutsche Gesellschaft für Internationale Zusammenarbeit (GIZ) GmbH, a German organization promoting economic development and employment, used data from the University of Notre Dame’s ND-GAIN Index — which ranks countries according to climate change vulnerability — and the International Labour Organization’s World Social Protection Report 2024-26 to examine the relationship between climate vulnerability and social protection gaps across Asia and Africa. Using infographics designed by Revisual Labs, they mapped out the vulnerability of countries to climate shocks against findings from the ILO’s report on social security coverage, benefits, and public spending in countries. Using a scrollytelling format with animated transitions between chart types, the findings revealed that countries most vulnerable to climate shocks, such as Pakistan, have less than half their populations covered by social protection. Using the scenario of a farmer dealing with unseasonal rains, illustrated comic panels explained how Adaptive Social Protection, which encompasses climate change adaptation, social protection, and disaster risk reduction, works to mitigate economic hardship.
Chinese Energy Loans in Africa
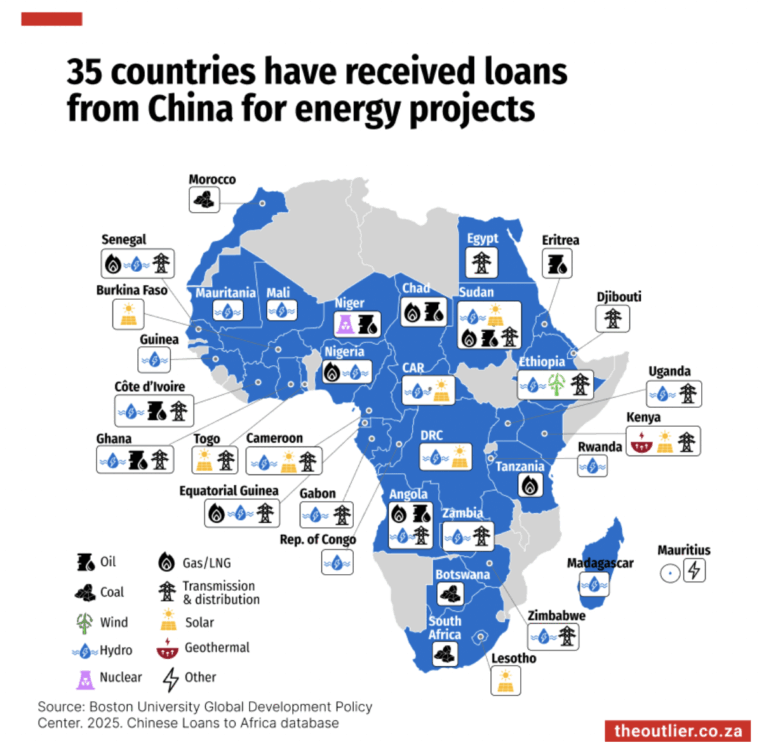
Image: Screenshot, The Outlier
South Africa’s The Outlier analyzed US$66 billion in Chinese energy loans distributed across dozens of African countries. Drawing on data from the Chinese Loans to Africa database at the Boston University Global Development Policy Center, the analysis showed that 207 energy-related loans were committed to 35 African countries, with roughly half allocated to transmission and distribution infrastructure. A map visualized the type of energy project loan in each of the countries, with more than 30 projects dedicated to hydroelectric power generation. Angola received 40% of total funding ($27.3 billion), followed in a distant second by South Africa at 7% ($4.5 billion). A bar chart showed loan distribution over time, revealing that 80% of the funds was issued between 2011 and 2019 during China’s Belt and Road Initiative, with lending having dropped off significantly after 2020.
Links Between Chat Room Stock Promotion and Pump-and-Dump Scams
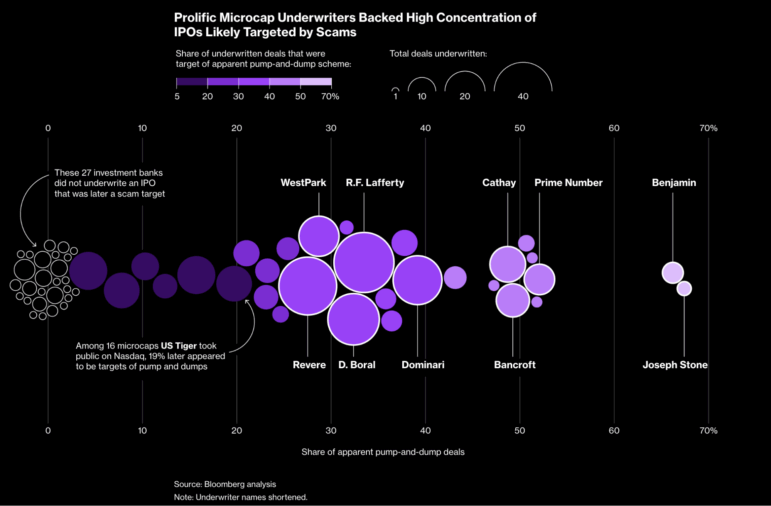
Image: Screenshot, Bloomberg
Using IPO data and social media messages from 2023 to 2025, Bloomberg analyzed over 250 companies that went public on Nasdaq’s smallest listing tier (Capital Market) and five microcaps — publicly traded companies with a market capitalization ranging from US$50–300 million — that went public on the New York Stock Exchange. This analysis found that one quarter of these listings were promoted in WhatsApp group chats before crashing or being suspended by the Securities and Exchange Commission (SEC) due to potential manipulative trading concerns. Bloomberg cross-referenced stocks whose prices plunged 50% over two trading days with watchdog sites, where users shared screenshots of social media chats hyping companies, which revealed approximately 60 firms showed “pump-and-dump” securities fraud patterns with a cumulative US$16 billion in value erased since 2023. Visualizations mapped individual IPOs by listing year and region, with highlights indicating apparent manipulation targets, showing that the majority were Asia-based companies. The investigation identified 30 underwriters who helped list foreign firms that were later promoted before stock crashes, with just eight underwriters handling nearly 75% of affected companies.
Waste in the River Rhine
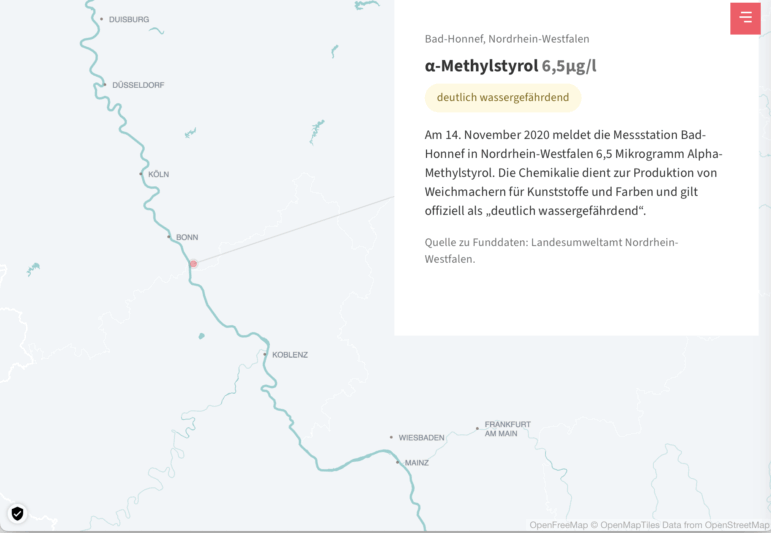
Image: Screeshot, Correctiv
An investigation by CORRECTIV reveals that thousands of largely unidentified chemicals from household and industrial wastewater are flowing through Germany’s longest river, with experts unable to rule out risks to drinking water and public health. Using water analysis data from German states along the Rhine: Baden-Württemberg, Rhineland-Palatinate, and North Rhine-Westphalia, CORRECTIV analyzed 65 instances of unusual substances detected in the river between 2020 and 2025. The analysis showed that only 44 of these substances could be definitively or probably identified. The investigation employed an interactive map of the Rhine, showing locations where authorities triggered the alert and warning plan 15 times between 2020 and 2025, with specific markers indicating chemical detection points. For example, in November 2021, the weed killer metazachlor, a suspected carcinogen, was detected at a Rhine monitoring station in the city of Worms. As a result, drinking water suppliers were informed as a precaution.
Hanna Duggal is the writer of GIJN’s fortnightly Top 10 in Data Journalism column, and a data journalist at AJ Labs, the data, visual storytelling, and experiments team of Al Jazeera. She has reported on issues such as policing, surveillance, and protests using data, and reported for GIJN on data journalism in the Middle East, investigating algorithms onTikTok, and on using data to investigate tribal lands in the US.

Tipsheet on Partnering with Civil Society Organizations and Non-Governmental Organizations

AI Accountability Reporting Guide

Guide to Mapping Analysis Using QGIS

Open Source Databases by Country

Visualizing a Trillion Dollars, India’s Warming Cities, Russian Mercenaries at Sea, and World Cup Player Physiques
‘Super’ El Niño Threat, Myanmar Villages Razed, California’s Billionaire Tax Bill, and South Africa’s Murder Rate

Cheap Drones Reshaping Warfare, Strait of Hormuz as Energy Chokehold, Starvation Strategy in Sudan, an Iceberg’s Final Journey
Four Years of Russia-Ukraine War, Sudan’s Child Soldiers on TikTok, India’s Untreated Tap Water, and Waning US Influence at the UN

This work is licensed under a Creative Commons Attribution-NoDerivatives 4.0 International License
Republish our articles for free, online or in print, under a Creative Commons license.
Republish this article
This work is licensed under a Creative Commons Attribution-NoDerivatives 4.0 International License
Read Next
Data Journalism Top 10
Visualizing a Trillion Dollars, India’s Warming Cities, Russian Mercenaries at Sea, and World Cup Player Physiques
Also highlighting how films portray Ukrainians, increasing tree cover in Spain, and how couples meet.
Data Journalism Top 10
‘Super’ El Niño Threat, Myanmar Villages Razed, California’s Billionaire Tax Bill, and South Africa’s Murder Rate
Also highlighting exploitation of journalists in Egypt, Argentina’s returning World Cup squad, and the strain on Singapore’s aging caregivers.
Data Journalism Top 10
Cheap Drones Reshaping Warfare, Strait of Hormuz as Energy Chokehold, Starvation Strategy in Sudan, an Iceberg’s Final Journey
Our round-up also highlights India’s highly polluted Yamuna River, a flash flood in Argentina’s Bahía Blanca, and how good (or bad) humans are at identifying AI-generated music.
Data Journalism Top 10
Four Years of Russia-Ukraine War, Sudan’s Child Soldiers on TikTok, India’s Untreated Tap Water, and Waning US Influence at the UN
Our round-up of the best in recent data journalism also highlights medical exam pass rates in Brazil, access to quality water in India, and the cost of competing in the Winter Olympics.