
The low cost of drones has created a military challenge for countries that rely on expensive interceptors to defeat them. Image: Screenshot, Reuters
Cheap Drones Reshaping Warfare, Strait of Hormuz as Energy Chokehold, Starvation Strategy in Sudan, an Iceberg’s Final Journey

Covering Iran’s Protests from Afar: Q&A with Radio Zamaneh’s Joris van Duijne
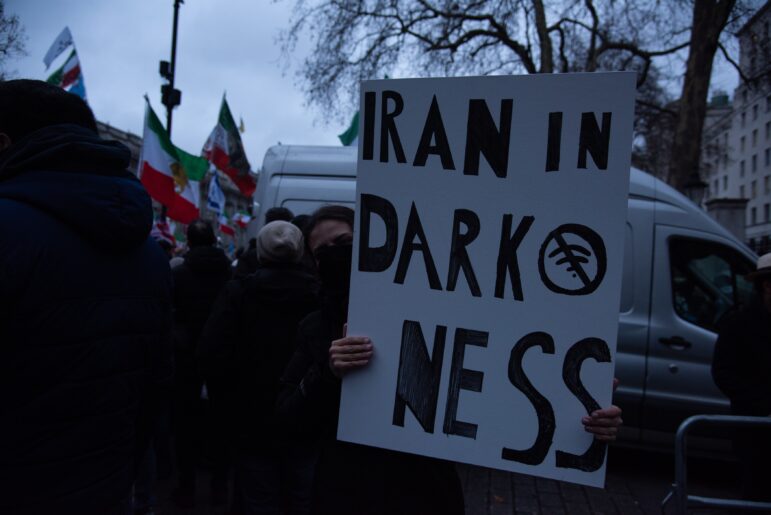
How BBC Experts Confirmed Hundreds Killed in Iran’s Protest Crackdown Despite an Internet Blackout

My Favorite Tools: Sigma Award-Winning Data Journalist Leonardo Nicoletti

Reporter’s Guide to Investigating Cryptocurrency
As the escalating conflict in the Middle East continues to dominate global news, data journalists and graphics teams around the world have been racing to make sense of its military, economic, and geopolitical consequences. Reuters illustrated how cheap drones and expensive interceptors are rewriting the rules of modern warfare as the US-Israel war with Iran enters its third week. Our roundup of the Top 10 in Data Journalism considers stories from March 1 to 18, and also includes The Hindu tracing the 34-mile toxic journey of the Yamuna river through Delhi, La Nación reconstructing how nearly five months of rainfall fell on Argentina’s Bahía Blanca in three hours last year, and the Guardian revealing how the Rapid Support Forces systematically destroyed farming communities around El Fasher, in the North Darfur state of Sudan.
How Cheap Drones Are Reshaping Warfare
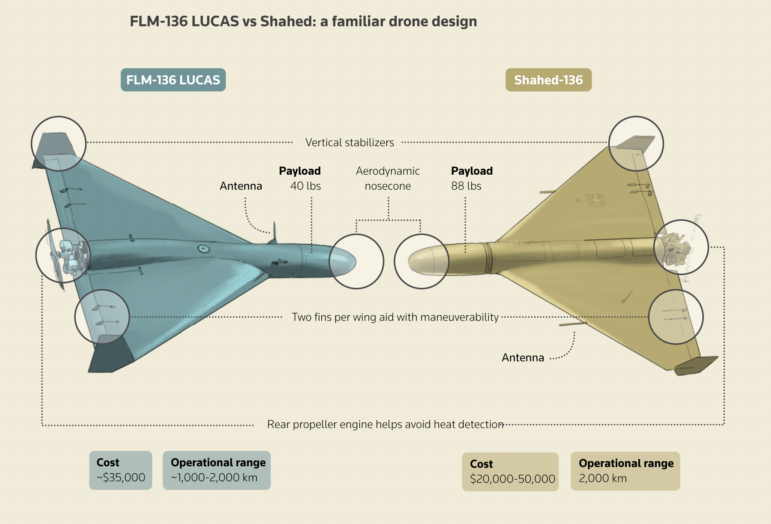
Image: Screenshot, Reuters
Reuters examined the cost asymmetry of the Iran conflict, using illustrated scroll-driven visuals to compare aircraft, one-way drones, and their price tags. Drawing on data from Boeing, Lockheed Martin, Raytheon, and Fortem Technologies, Reuters showed how cheap drones are eroding the advantage long held by wealthier militaries by tracking systems used in the US strikes on Iran, including US$4 million Patriot interceptors, which equal the cost of roughly 115 Iranian Shahed drones at US$35,000 each. Iran claimed to have launched over 1,000 drones in the first week of the conflict alone. A side-by-side schematic compared the US’s newly deployed FLM-136 LUCAS one-way attack drone with Iran’s Shahed-136, highlighting their near-identical design as Washington scrambles to keep pace with the rapid evolution of remote warfare.
Strait of Hormuz’s Stranglehold on the Global Economy
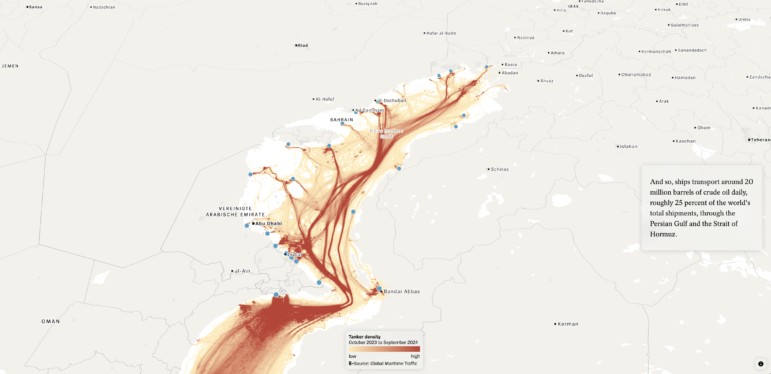
Image: Screenshot, Der Spiegel
Der Spiegel mapped the strategic importance of the Strait of Hormuz — “the most critical oil transport bottleneck in the world” — which has been essentially shut off since the US and Israel launched strikes on Iran three weeks ago. Using shipping data from Global Maritime Traffic and MarineTraffic and regional import breakdowns from the International Energy Agency (IEA), the piece documented the immediate economic consequences of Tehran’s closure of the waterway, finding that by March 2, nearly 380 tankers were stranded inside the Persian Gulf with a further 55 anchored at its entrance. The scrolly map illustrated the Strait’s role as a chokepoint in the global energy supply, and detailed how the risks have prompted insurers to cancel coverage for vessels in the region. Using export data from a commodity analysis firm, bar charts broke down the destinations of oil shipped through the strait in 2025, finding that 86% was bound for Asia, with China accounting for nearly a third of total shipment volume.
Yamuna River’s Toxic Passage Through Delhi
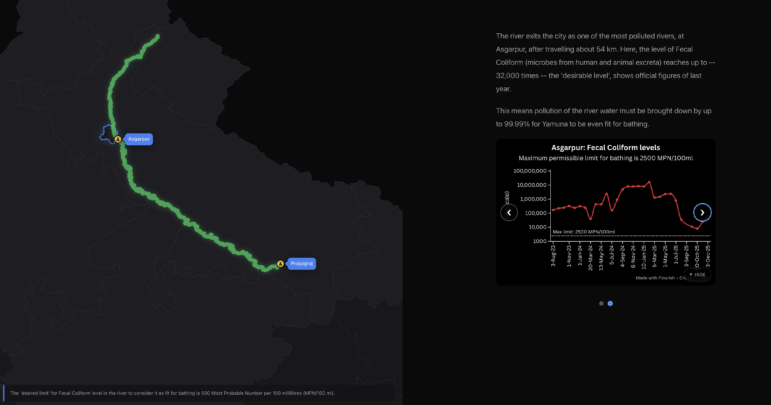
Image: Screenshot, The Hindu
The Hindu investigated the Yamuna river’s pollution crisis by tracing its 54-kilometer (34-mile) journey through Delhi — from Palla, where it enters the city, to Asgarpur, where it exits — as one of India’s most contaminated waterways. Reporters travelled the full stretch, collecting water samples at key points to visually document the river’s discoloration as successive drains are emptied into it. Using official government figures, the piece revealed that fecal coliform levels at Asgarpur reach up to 32,000 times the desirable limit, and pollution would need to be reduced by 99.99% for the river to meet basic bathing standards. Flourish-built charts and timelines tracked water quality fluctuations over time. At least 22 drains now discharge into the river in Delhi, with the Najafgarh drain alone responsible for almost 69% of total wastewater discharged and 70% of the pollution load, according to a report by the research nonprofit, the Centre for Science and Environment.
How Bahía Blanca Became a Deadly Trap
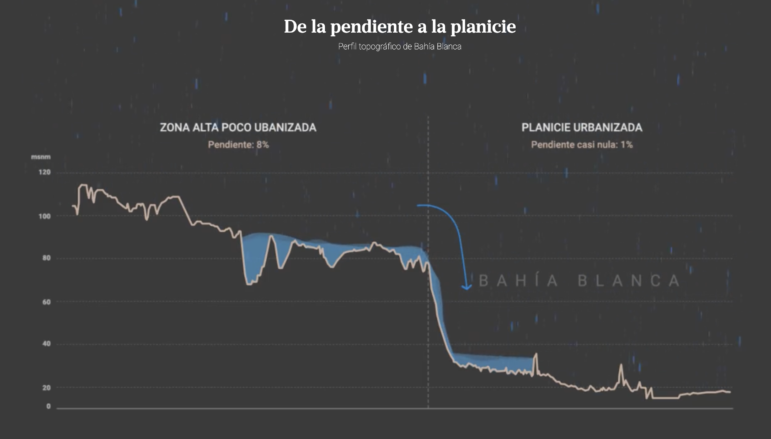
Image: Screenshot, La Nación
La Nación’s reconstruction of the March 2025 flood disaster in Argentina’s Bahía Blanca used a spatial model, drawing on data from the National University of the South (UNS) and the National Water Institute (INA) to explain how an extreme storm turned into a catastrophe. The piece documented how nearly five months’ worth of rainfall fell in under three hours between 4 and 7 a.m. A bar chart styled to mimic falling rain visualized the hourly accumulation in Bahía Blanca against nearby towns, with four rain gauges recording peaks of 348 millimeters (3.7 inches); a map timeline incorporated on-the-ground video footage to illustrate that water levels in some areas reached the average height of a professional basketball player. An annotated elevation chart of the city showed how its division between hilly and flat terrain funnelled debris-laden runoff from higher ground directly into low-lying residential areas, where inadequate drainage prevented the water from dispersing. Eighteen people were killed in the flooding, and 1,400 people displaced.
How Iran’s Naval Mines Work
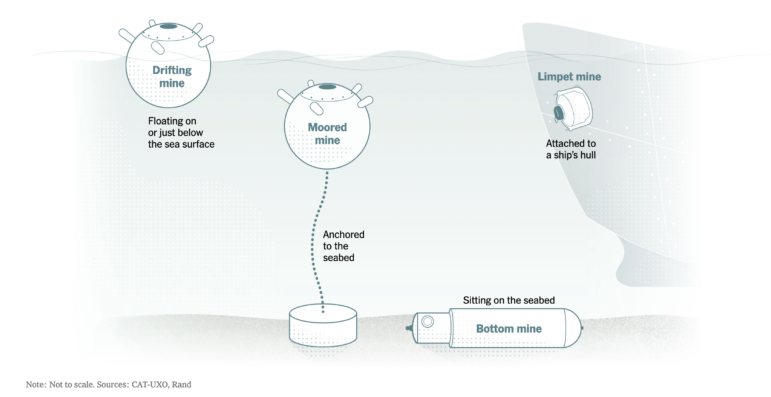
Image: Screenshot, The New York Times
The New York Times used annotated illustrations to unpack how Tehran could be deploying naval mines in the Strait of Hormuz. Citing Defense Intelligence Agency estimates, the piece noted that Iran has a stockpile of 5,000 naval mines. A bathymetric map showed that the strait’s shallow, narrow waters favor Iran, with depths of only about 200 feet and constrained shipping lanes that limit tanker maneuverability. Diagrams explained the four main mine types Iran has in its arsenal — moored, drifting, bottom, and limpet. The story also examined the potential challenges to clearing the strait and resuming shipping, contrasting precise sonar-led mine-hunting with faster, but less reliable, sweeping methods that trigger mines by mimicking ship signatures.
Starvation Strategy in Sudan
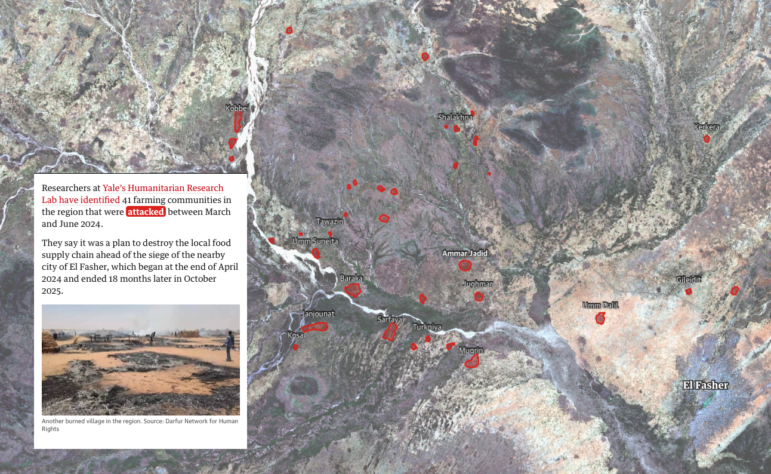
Image: Screenshot, the Guardian
The Guardian’s interactive investigation combined before-and-after satellite imagery of Ammar Jadid, a Sudanese village that had fed El Fasher — the capital of North Darfur state — for generations, to map its destruction by the Rapid Support Forces (RSF), a paramilitary force formerly operated by the government. Using remote sensor data to map fires, the piece showed that the RSF deliberately destroyed farming communities around El Fasher as a calculated strategy to starve the city into submission. Researchers at Yale’s Humanitarian Research Lab identified 41 farming communities in North Darfur that were attacked between March and June 2024, months before the RSF began its 18-month siege of El Fasher. Their findings reveal a 2,040% increase in fires across the affected villages during the period studied. A quarter of those villages were attacked more than once, and 68% showed no signs of normal habitation afterwards. Stanford Law School professor Tom Dannenbaum and Yale Law School professor Oona Hathaway argued that the targeted destruction of livestock enclosures, farming infrastructure, and the forced displacement of farmers constituted a war crime.
How Russia is Watching Ukraine From Space
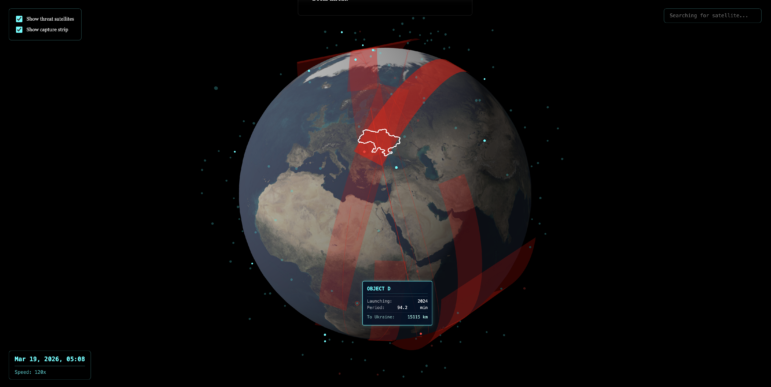
Image: Screenshot, Texty
Texty used a 3D orbital visualization to map all 253 Russian low Earth orbit (LEO) satellites currently circling the planet, 150 of which were launched after the full-scale invasion of Ukraine in 2022. At the center of the piece is an interactive globe that shows the live trajectories of every satellite, with toggles to highlight those posing the most direct surveillance threat over Ukraine and to display each satellite’s ground capture strip. Drawing on data from CelesTrak and the Union of Concerned Scientists, the piece classified Russia’s LEO fleet by purpose alongside 165 satellites whose true function Russia has not disclosed. A simulation of satellites passing over Ukraine between January 10 and 17 illustrated the intensity of coverage, finding that Ukrainian territory can be scanned for various purposes dozens of times per day. A clickable satellite-by-satellite explorer allows readers to search individual devices by name.
Hidden Cost of the Global Data Center Boom
Image: Screenshot, Dirty Data
This collaborative investigation led by the Environmental Reporting Collective used an interactive global map and a series of country-specific reports to document the environmental and human cost of the AI-driven surge in data center construction. The project — Dirty Data — plotted the status of data centers worldwide, such as those that are already operational, those under construction, and sites facing active opposition, allowing readers to explore the sprawling geography of the expansion. Key findings from the investigation showed that in Brazil, a planned US$90 billion “hyperscale” data center is set to occupy land in a flood-risk state. In India, an analysis of dozens of government filings found that it takes an average of US$770,000 in investment to create a single data center job. In Peru, more than 300 companies have registered to operate in the sector despite the absence of a national data center plan.
Final Journey of Iceberg A23a
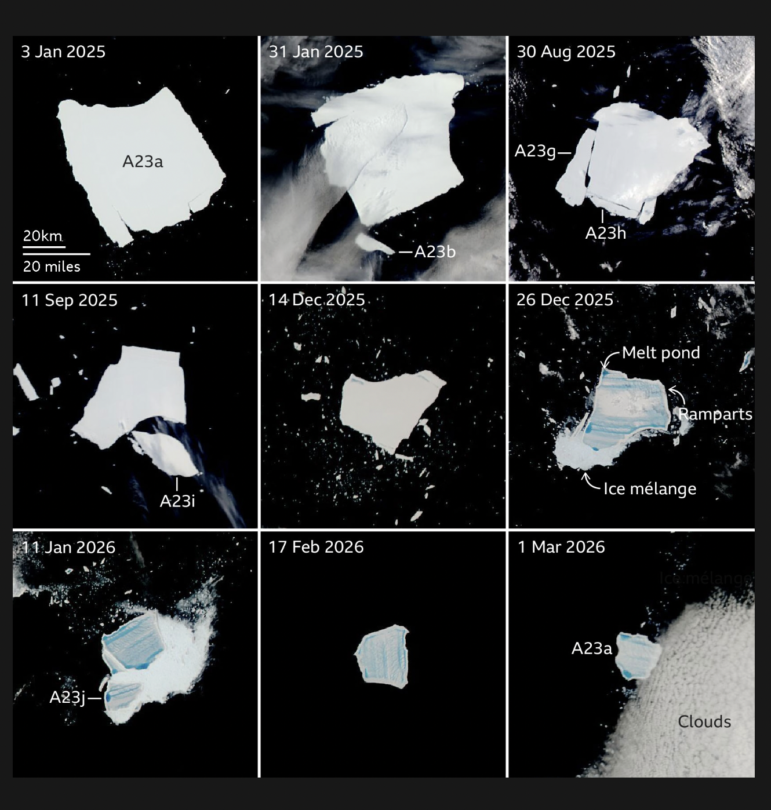
Image: Screenshot, BBC
The BBC mapped the journey of one of the world’s oldest icebergs over a 40-year period, from Antarctica to its “death throes” in the South Atlantic. Drawing on tracking data from the Antarctic Iceberg Tracking Database at Brigham Young University, the US National Ice Center, and NASA MODIS satellite imagery, the piece charted how the iceberg dubbed A23a, which broke away from the Filchner Ice Shelf in 1986 at a size of roughly 4,000 square kilometers (1,540 square miles), spent more than 30 years anchored in the muds of the Weddell Sea before breaking free in 2020. A scaled map of the English Channel illustrated the iceberg’s shrinkage in tangible terms — at the start of 2025, it would have almost bridged the Isle of Wight to Normandy, but by March 2026, it had shrunk to approximately 180 square kilometres. Scientists are studying A23a’s behavior and what it may reveal about the future stability of Antarctic ice shelves.
Flood of AI-Generated Music Impacts Human Musicians
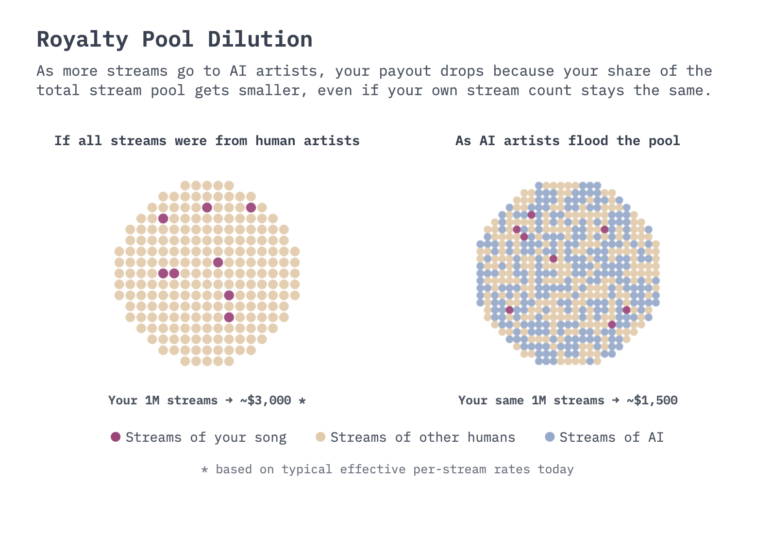
Image: Screenshot, PerThirtySix
Can listeners tell when music is created by a real artist, or when it’s been generated by AI? A 2025 Deezer/Ipsos survey showed that the vast majority of us can’t. This data essay in PerThirtySix, by creative technologist Shri Khalpada, used interactive quizzes and network diagrams to interrogate the rise of AI-generated music and its consequences for human artists. A listener quiz at the start of the piece asks readers to identify which of two clips in five genres across blues, classical, indie rock, jazz, and lo-fi was AI-generated. A chart showing royalty pool dilution revealed how a human artist’s one million streams, worth roughly US$3,000 today, could halve in value as AI tracks flood the market. The piece also documented the scale of AI music’s current reach: over 60,000 fully AI-generated tracks are uploaded to the music streaming app Deezer every day, accounting for 39% of daily uploads, while Suno — an AI music platform — generates seven million tracks per day. Despite this, most listeners — 80% — want AI-generated music to be clearly labeled.
Hanna Duggal is a data journalist at AJ Labs, the data, visual storytelling, and experiments team of Al Jazeera and a GIJN contributor. She has reported on issues such as policing, surveillance, and protests using data, and reported for GIJN on data journalism in the Middle East, investigating algorithms on TikTok, and on using data to investigate tribal lands in the US.
Covering Iran’s Protests from Afar: Q&A with Radio Zamaneh’s Joris van Duijne
How BBC Experts Confirmed Hundreds Killed in Iran’s Protest Crackdown Despite an Internet Blackout
My Favorite Tools: Sigma Award-Winning Data Journalist Leonardo Nicoletti
Reporter’s Guide to Investigating Cryptocurrency

This work is licensed under a Creative Commons Attribution-NoDerivatives 4.0 International License
Republish our articles for free, online or in print, under a Creative Commons license.
Republish this article
This work is licensed under a Creative Commons Attribution-NoDerivatives 4.0 International License
Read Next
Data Journalism Top 10 Editor's Picks
Editor’s Pick: Best of Data Journalism from 2025
Our roundup of standout data journalism from the past year highlights projects that delve into conflicts in the Middle East, Ukraine, and Africa, that explore the rise of AI, and interrogate global trade wars.

Data Journalism MENA Focus Week
How Middle Eastern Data Outlets Use Data to Challenge Narratives and Advance Accountability
Data journalism in the Middle East has been driven by organizations that have produced collaborations and projects that combine innovative techniques with nuanced local knowledge.

Methodology Reporting Tools & Tips
Q & A: Investigating TikTok Content Across the Russia-Ukraine Border
To investigate what the Russian invasion looked like to TikTok users in Russia and Ukraine, and how the content available differed from one side of the border to the other, a team of journalists from the Norwegian broadcasting company NRK set out to investigate the social networking site’s algorithms and how a user’s location provides differing digital narratives about the war.