Register for #GIJC25
November 20, 2025 • 09:00
-
day
days
-
hour
hours
-
min
mins
-
sec
secs

Accessibility Settings

color options

monochrome muted color dark

reading tools

isolation ruler

Series

Top 10 in Data Journalism

430 posts

Data Journalism

This Week’s Top 10 in Data Journalism

What’s the global data journalism community tweeting about this week? Our NodeXL #ddj mapping from January 1 to 7 has data journalism and data visualization roundups by @ddjournalism and @flowingdata, podcasts by @datastories and @fabrider, as well as an analysis on prices corresponding with ski resort altitudes by @duc_qn.

Data Journalism

This Week’s Top 10 in Data Journalism

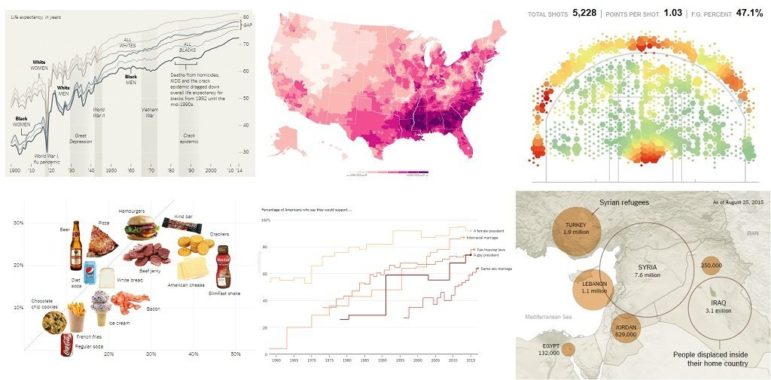
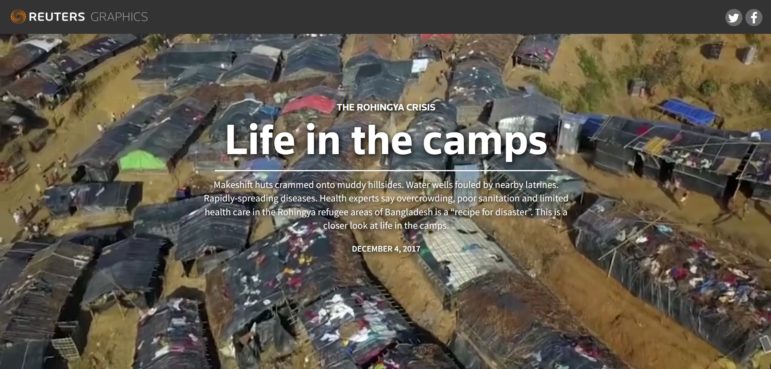
What’s the global data journalism community tweeting about this week? Our NodeXL #ddj mapping from December 4 to 10 has @Reuters documenting the deplorable living conditions at refugee camps in Bangladesh, Financial Times’ @theboysmithy transforming bad charts into useful ones and the impressive work of the 2017 @infobeautyaward winners.

Data Journalism

This Week’s Top Ten in Data Journalism

What’s the global data journalism community tweeting about this week? Our NodeXL #ddj mapping from November 27 to December 3 has @journocode’s festive data-driven advent calendar with tutorials and interviews, @FT mapping cities at risk of natural disasters affecting property prices, and a #VisualizationUniverse by Google News Lab and Adioma.

Data Journalism

This Week’s Top Ten in Data Journalism

What’s the global data journalism community tweeting about this week? Our NodeXL #ddj mapping from October 23 to 29 has @fedfragapane and @piaaaac visualizing six asylum seekers’ routes, @Recode breaking down the Gates Foundation’s philanthropic contributions by category and @lisacrost offering tips on how to choose a color palette for choropleth maps.

Data Journalism

This Week’s Top Ten in Data Journalism

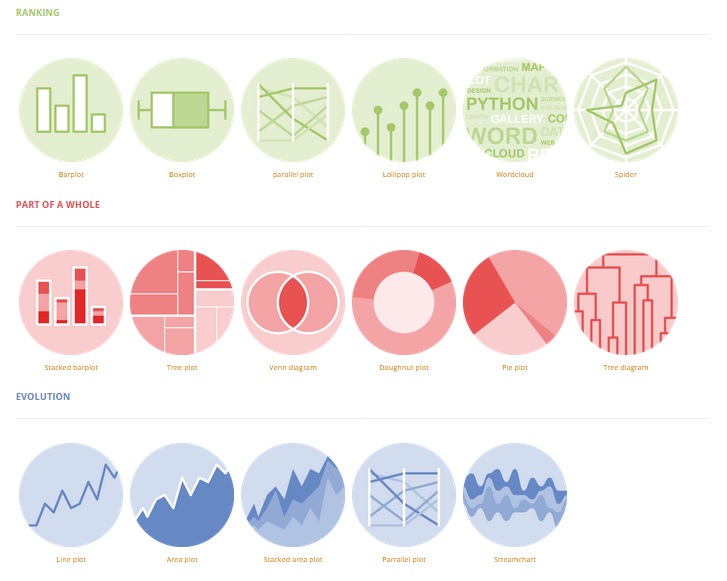
What’s the global data journalism community tweeting about this week? Our NodeXL #ddj mapping from October 16 to 22 has @Sage_News analyzing data journalism practices over the past four years, data expert @albertocairo weighing in on uncertainty in interpreting graphics, @tristanf listing 12 new digital story formats for news and @R_Graph_Gallery’s inspiring Python Graph Gallery.

Data Journalism

This Week’s Top Ten in Data Journalism

What’s the global data journalism community tweeting about this week? Our NodeXL #ddj mapping from October 9 to 15 has @RTSinfo looking into flight sharing platform @Wingly_UK, while @srfdata finds millions of fake @instagram followers, @jwyg charts the growth of all Internet sites, and @nytimes collaborates with @AmstatNews to promote critical thinking and data literacy.

Data Journalism

This Week’s Top Ten in Data Journalism

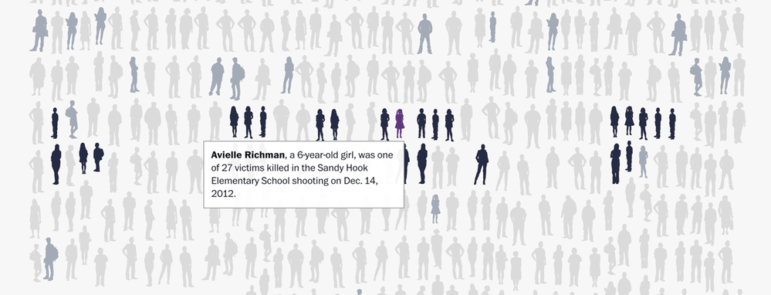
What’s the global data journalism community tweeting about this week? Our NodeXL #ddj mapping from October 2 to 8 has @source’s overview of two years of mass shooting visualizations in the US, @merbroussard’s callout for information to future-proof data stories and @paulbradshaw shares his four favorite computational thinking examples from @DailyMirror, @puddingviz, @BuzzFeed and @washingtonpost.

Data Journalism

This Week’s Top Ten in Data Journalism

What’s the global data journalism community tweeting about this week? Our NodeXL #ddj mapping from September 25 to October 1 has @FT mapping the route in a day of a London Uber driver, #NICAR18 registration opening up, @Lattif charting Africa’s internet shutdowns using @atlascharts and loads of German election data visualizations.

Data Journalism

This Week’s Top Ten in Data Journalism

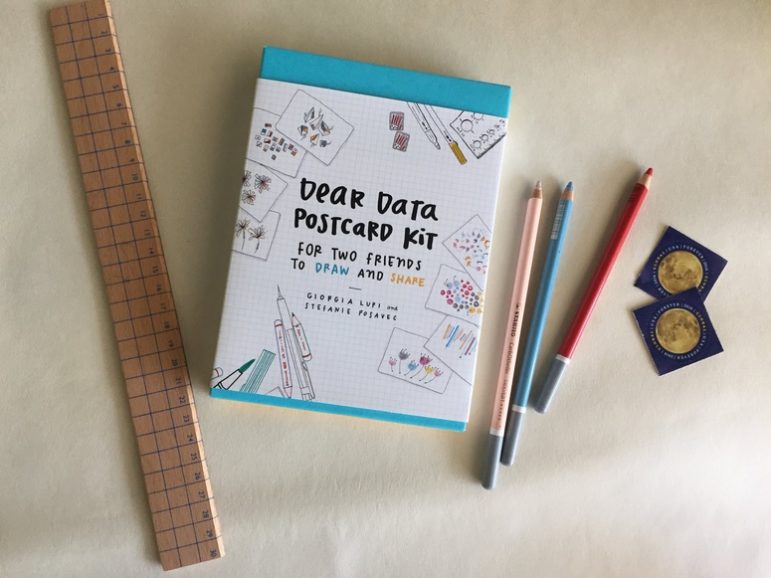
What’s the global data journalism community tweeting about this week? Our NodeXL #ddj mapping from Sept. 18 to 24 features Wikipedia of Data Visualization, the State of Data Journalism, Dear Data Postcard Kit, and German election data.

Data Journalism

Data Journalism’s Top Ten

What’s the global data journalism community tweeting about this week? Our NodeXL #ddj mapping from Sept 11 to 17 has @puntofisso using machine learning to map the average face of British politicians, @AftertheFloodco creating a font that turns numbers into sparklines, and @datassist listing seven deadly sins in statistical analysis.