
Humahuaca village in Jujuy province, Argentina. Image: Shutterstock
Guide Resource
GIJN/NAJA Guide for Indigenous Investigative Journalists
Chapter Guide Resource
Data Journalism on Indigenous Communities

Chapter Guide Resource
Land Ownership: Community Rights Under Threat

Chapter Guide Resource
Investigating Criminal Justice

Chapter Guide Resource
Exposing Exploitation and Corruption

Chapter Guide Resource
Covering the Climate Crisis

Chapter Guide Resource
Investigating Murdered or Missing Persons

Chapter Guide Resource
Indigenous Data Sovereignty

Chapter Guide Resource
Getting Documents, Dealing with Whistleblowers, and Staying Safe
Chapter Guide Resource
GIJC23 Indigenous Investigations Webinar


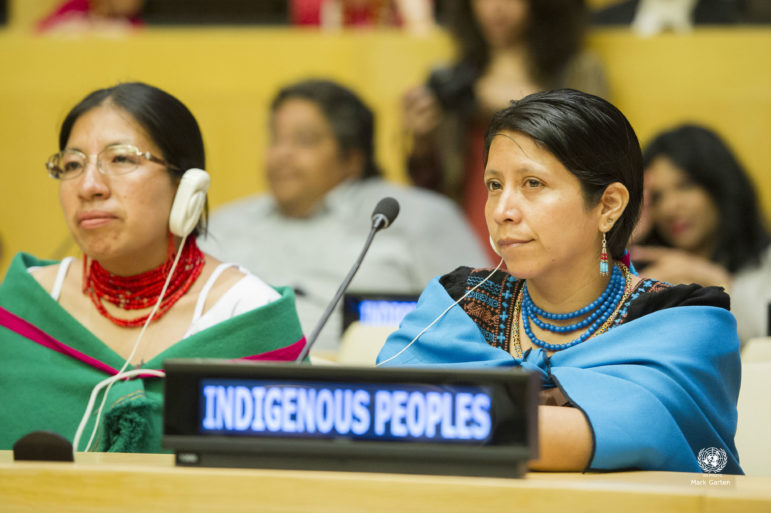
The absence or poor quality of data on Indigenous communities presents both challenges and opportunities for data journalism.
Because it is widely recognized that official data on Indigenous communities is faulty or sparse, reporters may need to look for alternative sources, or even create it themselves.
Although data journalism commonly refers to the use of existing data, it also can mean filling a data void. Creating data is more work, but the results can be impressive, unique, and highly impactful.

Members of the Ndebele Tribe in South Africa. Photo: UN Photo
This GIJN/NAJA guide will:
- Look at some of the issues concerning the available data on Indigenous people
- Discuss alternative sources of data
- Provide information on learning about data journalism
- Review data journalism tools
- Suggest some of the official places to look for data
Problems with National Data
Complaints about the data on Indigenous peoples are similar around the world.
One universal problem is that national data is not broken down enough – “disaggregated” in expert terminology – and thus fails to provide a meaningful picture of small populations such as tribes.
Also, census questions may not be specific enough. For example, gathering data on Sami suicides is difficult, experts said, because in Norway, ethnicity is not listed in government statistics (Reuters).
In addition, existing official data is often conceptually flawed, sometimes because Indigenous communities were not consulted. (Also see this guide’s chapter on data sovereignty.)
“From a Māori perspective, we were all too often the researched, not the researchers, and Māori realities were often portrayed as a strange and inferior ‘other’,” New Zealand Māori researcher Andrew Sporle said.
“Data are not neutral statistics,” said Maggie Walter, Pro Vice-Chancellor of Aboriginal Research and Leadership at the University of Tasmania, quoted in a Crikey article. “They overtly display the cultural, social, and political power imbalance between those collecting and analyzing those data, and those of us who are their data subjects,” said Walter, a member of the Tasmanian Aboriginal Briggs family.
Under-counting is another common issue.
The Amazigh (Berber) peoples of North Africa are 28% of the population, according to the most recent census in Morocco (2016). “Amazigh associations, however, strongly challenge this and instead claim a rate of 65% to 70%,” according to The Indigenous World 2019 report from the International Work Group for Indigenous Affairs, a global human rights organization.
An article critical of media reporting on education in Australia, which was published in That Munanga Linguist and written by Greg Dickson, criticized articles drawing attention to poor English proficiency among Aboriginal children. Such coverage overlooks, Dickson wrote, that “it is entirely acceptable, predictable, and expected” that children up to the age of five would be proficient only in their own Indigenous language. Dickson is “Manager, Languages and Cultures — Stronger Communities Ngukurr,” at the Yugul Mangi Development Aboriginal Corporation.
An overview on the lack of data in the US and the potential for community-based data efforts was provided by Malia Villegas, director of the National Congress of American Indians (NCAI) Policy Research Center and an enrolled member of the Native Village of Afognak in Alaska, in her chapter in the book Handbook of Indigenous Education.
“Community engagement on indicators, data use, and measurement,” she noted, “are also critical in improving the research enterprise and in leading to improved outcomes for Native youth and families.”
The theme of “Measuring Indigenous Identification” was the subject of a special issue of The Statistical Journal of the International Association for Official Statistics, published in early 2019 and organized by members of the International Group for Indigenous Health Measurement (IGIHM). The articles focus on measurement issues, with an emphasis on health. An opening editorial by Michele Connolly, co-chair of the group and an enrolled member of the Blackfeet Nation of Montana, states: “Indigenous people have many stories to tell and some of these stories, as shown in this edition, have been difficult to tell, for statistical and non-statistical reasons – small sample sizes, data ownership, or misinterpretation of results, to name a few.”
Building Datasets
Indigenous and nongovernmental organizations are attempting to fill data vacuums by engaging in their own research.
For example, the Swinomish Indian Tribal Community created a set of community-based indicators of health, specific to Native American tribal communities in the Puget Sound/Salish Sea region of the Pacific Northwest.
The Indigenous Health Indicators (IHIs) “reflect non-physiological aspects of health (community connection, natural resources security, cultural use, education, self-determination, resilience) on a community scale, using constructed measures that allow for concerns and priorities to be clearly articulated without releasing proprietary knowledge.”
An international project called Indigenous Navigator helps Indigenous communities generate quality data which better serves to document and communicate their particular situation. “These data have been used by journalists as a starting point,” David Nathaniel Berger, Programme Coordinator, said in an email. For example, 19 communities in Bolivia have completed the full surveys and made portions of the data available in the Navigator.
This page may also be useful for journalists wanting to better understand major Indigenous rights mechanisms and how these instruments translate into policy and real protections.
First Languages Australia developed an interactive map to display and promote the diversity of Australia’s Aboriginal and Torres Strait Islander languages. The data was contributed by regional language centers and programs working directly with language communities.
Journalists Gathering Data
Journalists have created databases, though there appear to be few created about Indigenous issues.
Some reporters build on public data, pulling together information from various sources, and supplementing it with additional records research.
ProPublica’s Collaborative Data Journalism Guide covers:
- Types of newsroom collaborations and how to start them
- How a collaboration around crowdsourced data works
- Questions to consider before starting a crowdsourced collaboration
- Ways to collaborate around a shared dataset
- How to set up and manage workflows in data collaborations
In addition, a chapter from the Data Journalism Handbook 2 offers more examples and guidance on how to create such databases, including ethical advice.
Here are a few illustrative examples that provide some idea of what is possible.
The Washington Post published a significant portion of a database that tracks the path of every opioid pain pill, from manufacturer to pharmacy, in the United States between 2006 and 2012.
ProPublica’s Dollars for Doctors project compiled data on payments to doctors and teaching hospitals that were made by pharmaceutical and medical device companies.
In Tanzania, stories supported by the European Journalism Centre explored why some older widows who do not have male descendants marry younger women who do — to maintain land rights.
“We used paralegals on the ground to tell us about how many female marriages there were in 10 different villages and it turned out that the number of female marriages now represented over 20% of households,” reporter Marta Martinez explained.
Oregon Public Broadcasting’s KUOW 2019 investigation on prison deaths, “Booked and Buried,” was based in part on a custom database, allowing it to report, “While Native Americans make up less than 2% of the population in Washington and Oregon, they represent more than 4.5% of jail deaths.”
The US publication The Discourse visited 40 tourist shops over three months and logged over 260 items to figure out just how much of Vancouver’s tourist market sells authentic Indigenous souvenirs. Reporter Francesca Fionda found that some knock-off Indigenous art is sold in 75% of Vancouver souvenir shops. She later wrote about how she did it.
Data Collection Ethics
For official and media researchers, ethical considerations may be especially pertinent when trying to learn about small Indigenous populations.
In the US, each tribe may have its own definition of research and its own set of research protections and laws, as described generally in this National Congress of American Indians policy report.
Also see an interview on the topic by Desi Rodriguez-Lonebear, a co-founder of the US Indigenous Data Sovereignty Network and a citizen of the Northern Cheyenne Nation and Chicana. She quotes a tribal leader as saying: “Sovereignty as tribal nations was given to us by the Creator. It is sacred. Data to exercise our sovereignty is also sacred.”
Researchers must follow federal, state, and tribal law, according to an explanation by NCAI.
Locating Official Records
A preliminary issue is figuring out who has data.
It’s virtually impossible to pinpoint all the potential sources of information in this resource, but below are some suggestions.
- Government agencies are logical places to start. There may be overall census information and studies by specialized agencies focused on areas such as health, education, etc.
- Hospitals, schools, corporations, and social service providers may also have data.
- In addition, look for nongovernmental organizations that follow the subject matter of interest.
- Don’t overlook academic research, often based on unique studies.

Flower H’mong hill tribe women in Can Cau, Viet Nam. Photo: UN Photo/Kibae Park
Requesting Data
Getting your hands on official data may be as easy as going to a website, if you’re lucky. Otherwise, you’ll need to request it. Try informally, first. But potentially you’ll need to file an official request through an access to information law.
Datasets, like documents, are covered by access laws. There are exemptions that may limit disclosure, the most pertinent one in this context being for the protection of personal privacy.
Researching exactly what data exists is critical to success. This is important because requests should be as precise as possible.
In many jurisdictions, information can be provided in the form requested. Again, inquire about how the data is kept and how it can be provided. Seek it in a desirable format for analysis.
If a request is denied, appeal through the mechanisms provided.
GIJN’s Global Guide to Freedom of Information provides many tips on how to make successful requests and a comprehensive list of national sources for acquiring records.
At the end of this resource page, you’ll find a list of some specialized national sources of information. Please tell us about other sources by writing to us here.
Guides to Doing Data Journalism
There are many resources to help you learn about computer-assisted journalism. To start, check out the following books and prizewinning work by leading data journalists around the world.
Precision Journalism: A Reporter’s Introduction to Social Science Methods (Fourth Edition). This is a must-have for data journalists. It was written by one of the pioneers in using data and social science techniques for reporting, Philip Meyer. The US-based Investigative Reporters and Editors’ data journalism award is named after Meyers.
The Data Journalism Handbook 2 (2019), revised and expanded from the Data Journalism Handbook (2012). Both provide helpful overviews of data journalism. It is edited by Jonathan Gray and Liliana Bounegru of the Public Data Lab with contributions from leading European data journalists. (Available in Arabic (PDF), Azerbaijani, Chinese, English (PDF), French, Greek, Japanese, and Spanish.)
Read some of the best data journalism here:
Past winners of IRE’s Philip Meyer Awards.
The shortlist for the 2019 Data Journalism Awards competition, sponsored by the Global Editors Network.
A more extensive list of resources on data journalism, including materials for sale, a list of conferences, and places to get training is available on the GIJN Data Journalism Resource Page.
Getting Started — Tipsheets
If you’re new to data journalism, there are many free online tipsheets to help you get your bearings.
Data Journalism: MaryJo Webster’s Training Materials is a collection of resources for beginning data journalists that includes general data advice, a list of book recommendations, instructions about several programming languages and spreadsheets, and data story ideas. MaryJo Webster is a data journalist with The Minnesota Star-Tribune.
Data Journalism Tools by MIT’s Knight Science Journalism program provides a list of books, conferences, tools, and databases for journalists.
Diving into Data Journalism (2016) by Samantha Sunne for API is a general guide that covers principles of data journalism, starting a data team in a newsroom, and challenges in data journalism.
Quick Guide to Data Journalism by DataCamp defines data journalism, offers advice on which programming languages to learn, and includes links to books, Twitter accounts, and other resources.

Photo: Unsplash
Getting Data — Scraping
Scraping refers to using a tool or writing a program that automatically pulls data from a website. Below are some resources for learning to scrape data from websites, no matter what your comfort level with coding.
Journocode (2019) offers a great overview of scraping basics by a group of journalists and technologists based in Germany.
This chapter from The Data Journalism Handbook 1 includes tips for scraping and some code examples.
Samantha Sunne outlines the basics of scraping in this presentation. It also contains links to more tools for beginners to start scraping websites.
Prepping Data
Once you have your data, check out these free online tipsheets and tutorials for advice on how to inspect and clean it before you start analyzing.
Data Biographies: How to Get to Know Your Data (2017) is a blog post by Heather Krause of the Canadian data journalism consulting website idatassist that walks through the process of interrogating the contents and collection process (as well as potential shortcomings) of a dataset before analyzing the data.
The Quartz Guide to Bad Data (2018) is a file on GitHub that discusses the most common problems found in datasets and how to solve them. It has been translated into Chinese, Japanese, Portuguese, and Spanish.
This tutorial by Belgian data journalist Maarten Lambrechts is an introduction to using Excel to clean and standardize messy data. The training requires a free account with www.Datajournalism.com.
Tools for Scraping, Cleaning, and Prepping
Got dirty data or pesky PDFs? These programs can help you get your data into a format you can use.
OpenRefine is a free tool for exploring, cleaning, and matching data. It is particularly useful for dealing with messy data. It is available in English, Chinese, Spanish, French, Russian, Portuguese (Brazil), German, Japanese, Italian, Hungarian, Hebrew, Filipino, Cebuano, and Tagalog. Here is a good tutorial on OpenRefine.
Extracting data from PDFs is a task that many journalists have to deal with. Several free tools make the job easier. Tabula is an open-source tool designed to extract tabular data from pdfs. Another free tool is XPDF, which supports several languages other than English. CometDocs is another tool that offers free limited accounts, as well as paid plans that offer more online storage and larger file upload sizes.
CSVkit is a suite of command-line tools for converting to and working with CSV, the most common tabular file format.
Workbench is a set of tools for scraping, cleaning, and analyzing data from Columbia’s School of Journalism.
Analyzing Data — Spreadsheets
Spreadsheets often are the first data tool journalists learn to use. They come in handy for cleaning and analyzing data in structured formats such as .csv files. Microsoft Excel and Google Sheets are the most commonly used spreadsheets.
Data Journalism Training: Beginner Excel is a tutorial by US journalist MaryJo Webster that explains how to prep data for use in Excel and demonstrates some of the basic functions with animated screenshots. This tutorial is targeted toward PC users, but most of the functions are the same for Mac users.
Finding Stories in Spreadsheets (2016) by UK journalist Paul Bradshaw is a great resource for beginning data journalists. It provides guidance for finding stories from the new data journalist’s best friend — the spreadsheet. (Available to purchase.)
A Reporter’s Guide to Excel (2016) provides screenshots and step-by-step instructions in the basic uses of Excel in journalism, such as pivot tables and data cleaning. It also includes a link to sample spreadsheets that can be used for practice.
Spreadsheets for Journalism (2019) is a quick, gentle introduction to the uses of Excel in data analysis by US-based journalism professor Brant Houston. It explains some of the practical situations when Excel would be useful, and it demonstrates how to calculate a ratio and perform other useful mathematical operations.
Photo: Flickr/Janneke Staaks
Analyzing Data — SQL
SQL is a commonly used language for working with databases. It is particularly useful for working with larger datasets that can bog down Excel and for joining separate datasets for analysis. Several open-source versions are used in newsrooms, including PostgreSQL and DB Browser for SQLite.
Excel to SQL Crosswalk (2017) by MaryJo Webster is a tipsheet that demonstrates the similarities between Excel and SQL for journalists who want to learn SQL and are already somewhat familiar with Excel.
Analyzing Data — Python
Python is one of the most popular programming languages for data journalists, and it is useful for scraping websites as well as cleaning and analyzing data. Here are some resources for learning to code in Python.
A Byte of Python is an online book dedicated to the basics of Python. It is targeted at those with little to no experience with the language. It also comes with a GitHub repository that includes exercises.
First Python Notebook is a step-by-step guide to Python designed for beginners by Los Angeles Times editor and long-time data journalist Ben Welsh.
Mapping
If you have a dataset involving geographic locations, these tools and tipsheets can help you analyze your data using maps. The most commonly used mapping programs in newsrooms are ArcGIS from Esri (which has free options for journalists) and the open-source program QGIS. Some also are useful for visualizing, but we’ve added a separate list for visualizing with maps.
Datajournalism.com offers this mapping tutorial using QGIS and CartoDB by freelance data journalist Maarten Lambrechts.
Mapping for Stories: A Computer-Assisted Reporting Guide (2017): This is a step-by-step handbook for using QGIS to analyze data using maps and includes online practice data. The authors, US journalists Jennifer LaFleur, David Herzog, and Charles Minshew, teach GIS training for Investigative Reporters and Editors. An earlier version of this book is based on ArcGIS from Esri. (Available for purchase from IRE.)
R
R is a popular programming language most commonly used for data cleaning, statistics, and data visualization. Both the R program and RStudio are open source.
Practical R for Mass Communication and Journalism (2018): This is a great starter guide for using R for journalism by US journalist Sharon Machlis, a long-time champion for using R in newsrooms. Six chapters are online for free here. (Partially free online.)
Datajournalism.com offers this introduction to R tutorial by German data journalist Marie-Louise Timcke and an Intro to R tutorial from long-time US data journalist Ron Campbell.
Visualizing Data
Creating graphs, charts, or maps will dramatize your results. Here are some resources to help you display your data in visually appealing, reader-friendly formats.
Fundamentals of Data Visualization (2019) by Claus O. Wilke covers the basics of data visualization in R, and gives particular attention to common pitfalls that can lead to misleading graphics. Wilke is chair of the integrative biology department at the University of Texas at Austin. The book is available for purchase and is also free online.
The Truthful Art (2019) by Alberto Cairo offers both theoretical principles and practical instructions on data visualization for journalists.
Visualization Tools
There are a plethora of programs available for data visualization. Some are very simple to use and require no coding, while others are more difficult to learn but offer greater flexibility and interactivity. For a list, see the GIJN Data Journalism Resource Center.
Sources for Getting Started With Data
This is only a partial list, but hopefully it’s helpful.
US Agencies
The US Census Bureau’s American Indian and Alaska Native Programs. The Census Bureau has two main programs designed to collect and maintain geographic information on tribal areas: the Boundary and Annexation Survey (BAS) and the Tribal Statistical Areas Program (TSAP).
Federal American Indian and Alaska Native Data Collections. In 2016, US government agencies created large inventory of federal databases. See “Native American” issues here, or download the inventory (PDF).
Tribal
National Congress of American Indians Policy Research Center. “The mission of the NCAI Policy Research Center is to provide tribal leaders with the best available knowledge to make strategically proactive policy decisions in a framework of Native wisdom that positively impact the future of Native peoples.”
For statistics on Native American and Alaskan Native data sources see the Data Resources section. Also check out the Regional Profiles page on Using Science to Build Tribal Capacity for Data-Intensive Research. Among other things, see a 2018 report assessing The State of Tribal Data Capacity in Indian Country.
The US Indigenous Data Sovereignty Network is hosted by the Native Nations Institute at the University of Arizona. Look under “Resources” for other North American groups.
Look for tribal sources of information too, such as:
The Tribal Nations Research Group promotes research relevant to the Turtle Mountain Band of Chippewa Indians. “The research results provide custom-fit data and data ownership, promotes public and private economic development and opportunity, and upholds positive images of Turtle Mountain Band of Chippewa Indians.”
Canada
StatsCan, the government data website, includes a page called Statistics on Indigenous Peoples.
First Nations Information Centre: In 2018, this nonprofit organization released the results of a landmark five-year survey process conducted by FNIGC and its regional partners across the country, the National Report of The First Nations Regional Health Survey Phase 3: Volume 1.
The more than 80 charts and figures published in the report are available on FNIGC Data Online, FNIGC’s free-to-use data tool. Also potentially useful: a list of partners.
Australia
Australian Bureau of Statistics has a page called Aboriginal and Torres Strait Islander Peoples. ABS conducted the National Aboriginal and Torres Strait Islander Social Survey (NATSISS).
Closing the Gap is a government effort to improve the lives of Aboriginal and Torres Strait Islander Australians that includes regular reporting on progress.
The Australian Institute of Health and Welfare, a government-funded statistics agency, conducted the first national study of how forced separations affected children in subsequent generations.
Indigenous Data Network: Based at the Indigenous Studies Unit, University of Melbourne, the network coordinates support to organizations collecting and storing data about Indigenous Australians. See a 2019 “road map” for a list of sources.
There are some community data projects, such as the Yorta Yorta nation’s new Algabonya Data Unit.
Creative Spirits, an educational website run by Jens Korff, has a fact page on demographics.
The Lowitja Institute is a national institute for Aboriginal and Torres Strait Islander health research.
New Zealand
Stats NZ is New Zealand’s official data agency.
The data.govt.nz catalogue shows all government datasets.
Te Hiringa Tamariki Baseline Measure: This 2019 report from UNICEF New Zealand not only includes plenty of data on children, but also makes the case that young Māori need to be measured against their own standards.
Latin America
The Center of Distributive, Labor and Social Studies (CEDLAS) is a research center that specializes in the empirical study of distributive, labor, and social issues in Latin America. Created in 2002, CEDLAS is based at Facultad de Ciencias Económicas – Universidad Nacional de La Plata, Argentina. It produces the Socio-Economic Database for Latin America and the Caribbean (CEDLAC).
Indigenous Latin America in the Twenty-First Century, a 2018 report by the World Bank, is based on microdata extracted from censuses in 16 countries and household surveys in nine countries. “The report makes a critical analysis of the many inconsistencies present in much of the data, which in many cases are intrinsic to the difficulties of approaching indigenous issues with tools and data sets not originally intended to account for or include indigenous peoples’ voices and special needs.”
Africa
Code for Africa is a nongovernmental organization that helps citizens and others collect and use data. Its repository holds almost 2,700 datasets.
For example, one is “Land data on South Africa by mining land per province, cultivated land, registered farm portions, state-controlled land, tribal land and arable land by province.”
It has also gathered data. For example, Nairobi does not regularly monitor its urban air quality, so Code for Africa uses 22 low-cost air quality sensors to collect data, according to a 2018 description of the project.
International
Visibility of indigenous peoples in sustainable development indicators: Richard Madden and Clare Coleman, Australian academics, describe information gaps in the context of measuring progress toward achievement of the United Nations Sustainable Development Goals (2018).

This work is licensed under a Creative Commons Attribution-NoDerivatives 4.0 International License
Republish our articles for free, online or in print, under a Creative Commons license.
Republish this article
This work is licensed under a Creative Commons Attribution-NoDerivatives 4.0 International License
Read Next
Chapter Guide Resource
Indigenous Data Sovereignty
For Indigenous peoples worldwide, the lack of good data about their communities and their limited control over the collection and use of the data have serious consequences.

Case Studies
Indigenous Journalists Lead on Groundbreaking Investigations
Indigenous communities are often under siege by dominant cultures, and suffer the consequences of colonialism. Their resources stolen, and their people subjected to discrimination and abuse. Indigenous journalists from Australia, Canada, and the United States talk about their award-winning investigations, ranging from forced displacement to fake tribes, and deaths in custody.

Member Profiles
Building Memory, Documenting the Truth: The Case of Nicaragua’s Confidencial
With hundreds of the country’s reporters in exile, the press is under pressure like never before. But this outlet is continuing to report despite all its staff now being based overseas.

How They Did It
Uncovering the Hidden Environmental Impact of an Industrial-scale Hog Farm
An award-winning project exposed how a US-governor’s pig farming company polluted groundwater, revealing issues of political influence and regulatory neglect.