Register for #GIJC25
November 20, 2025 • 09:00
-
day
days
-
hour
hours
-
min
mins
-
sec
secs

Accessibility Settings

color options

monochrome muted color dark

reading tools

isolation ruler

Posts

707 posts

Data Journalism

GIJN’s Data Journalism Top 10: Game of Thrones Deaths, Visualizing Rich Hungarians, European Parliament

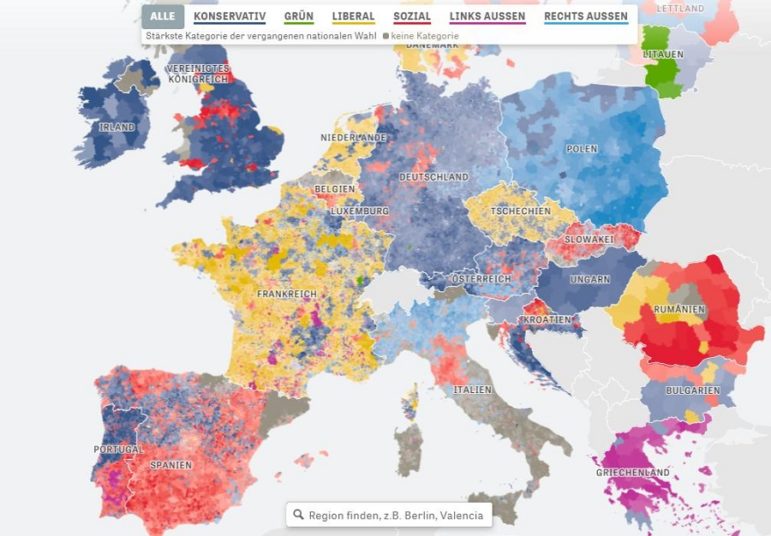
What’s the global data journalism community tweeting about this week? Our NodeXL #ddj mapping from May 20 to 26 finds @PostGraphics’ meticulous cataloguing of all on-screen deaths in Game of Thrones, @datajournalism’s tips on covering the crime beat, @DIEZEIT’s analysis of a politically diverse European parliament, and a quick beginner’s guide to learning data visualization by @AlliTorban.

Data Journalism

GIJN’s Data Journalism Top 10: Moscow Garbage, Mexican Homicide, EU Ideologies

What’s the global data journalism community tweeting about this week? Our NodeXL #ddj mapping from May 13 to 19 finds a preview snippet on sensible charts from @albertocairo’s upcoming book “How Charts Lie,” @ladatamx’s report on homicides in Mexico, @RepublikMagazin’s analysis on the changing ideologies of political parties in the European Union, and a recap of the Data Journalism UK conference by @paulbradshaw.

Data Journalism

GIJN’s Data Journalism Top 10: Weak Passwords, Wolf Drama, Chart Chooser, London vs. England

What’s the global data journalism community tweeting about this week? Our NodeXL #ddj mapping from May 6 to 12 finds @SteveFranconeri’s chart chooser based on data formats instead of visualization functions, @daswasfehlt’s examination of Austrian politicians’ weak email passwords in the wake of a major data leak, @NZZ’s look at whether wolves are really a nuisance in Switzerland and @wihbey’s research into the data competence and partisanship of journalists.

Data Journalism

GIJN’s Data Journalism Top 10: Populism Popularity, DataViz Pedagogy, National vs. Local Media, German Migration

What’s the global data journalism community tweeting about this week? Our NodeXL #ddj mapping from April 29 to May 5 finds @zeitonline mapping German migration post-reunification, @FILWD pointing out the gaps in current data visualization teaching syllabi, @AlJazeera launching its data journalism introductory guide, and @WSJ highlighting the stark divide between national and local media in the United States.

A GIJN Webinar with Paul Myers: An Investigative Approach to Online Research

Don’t miss GIJN’s first webinar with BBC’s top online sleuth Paul Myers on May 22 at 10am EST. Myers, a favourite at GIJN’s conferences and an expert in online investigative research, will spend an hour sharing effective techniques in using Google and social media for digging up information on people of interest. And you’ll have a chance to ask him questions. Sign up now!

Reporting Tools & Tips

10 Tips on Investigating Extrajudicial Killings: A Case Study from the Philippines

Reporting on extrajudicial killings — murders carried out by state actors or by non-state vigilantes with the cover of state sanction — poses specific challenges to investigative journalists. Here are tips from two extraordinary reporters working in the Philippines: Rappler’s Patricia Evangelista and Reuters’ Clare Baldwin.

Data Journalism

GIJN’s Data Journalism Top 10: History of Infographics, Colorism in Fashion, Weather Trends

What’s the global data journalism community tweeting about this week? Our NodeXL #ddj mapping from April 22 to 28 finds an interesting breakdown of colorism in fashion by @puddingviz, a series of gorgeous maps on natural disasters and extreme weather trends in the United States by @PostGraphics, a preview of a book on the history of infographics by @srendgen, and @UpshotNYT’s recap of its best articles from the past five years.

Data Journalism

GIJN’s Data Journalism Top 10: Data Feminism, Blockchain for Investigations, Train Speeds, EU DataViz Conference

What’s the global data journalism community tweeting about this week? Our NodeXL #ddj mapping from April 15 to 21 finds an informative interactive tool about the health of our generation by @srfdata, a piece by academic @wsaqaf explaining how journalism can utilize blockchain for investigations, data visualization teaching materials by @R_Graph_Gallery, and a book draft on data feminism by @kanarinka and @laurenfklein.

Data Journalism

GIJN’s Data Journalism Top 10: AI-Powered Investigations, Why Companies Donate, Data From PDFs, UK Pay Gap

What’s the global data journalism community tweeting about this week? Our NodeXL #ddj mapping from April 8 to 14 finds a zine focused on machine learning-powered investigative journalism produced by @bxrobertz, a video explainer from @FT on whether big corporations are really generous or just avoiding taxes, @knowtheory and @amandabee reviewing seven optical character recognition tools and @workbenchdata offering a tutorial on visualizing @Twitter data.

Data Journalism

GIJN’s Data Journalism Top 10: Copycat Laws, Melting Ice, Rwanda’s Genocide Trials, Data Do’s and Don’ts

What’s the global data journalism community tweeting about this week? Our NodeXL #ddj mapping from April 1 to 7 finds @JuliaAngwin sharing do’s and don’ts of data journalism projects at @journalismfest, @elconfidencial highlighting the negative effects on Spain’s economy if women stopped working for a day, @azcentral and @USATODAY revealing just how many bills in the United States are copied from model legislations, and @justiceinfonet visualizing data on trials for the Rwandan genocide.