

An Olympic-size swimming pool. Image: Shutterstock
Journalists often use standard references to put large or small things in perspective. It can help readers understand facts and concepts by comparing something unfamiliar with something more widely known.
We compare larger amounts to how many Olympic-sized pools they would fill. For lengths or areas, we use a football field or pitch.
This GIJN guide will give you a variety of references to use for different types of measurements, along with story examples that have used them. We’ll also give you some tools, tip sheets, and a bonus quiz.
Of particular interest to an international organization like GIJN is that comparisons are universally understandable.
In his book “Damned Lies and Statistics: Untangling Numbers from the Media, Politicians, and Activists,” sociologist Joel Best warns, “Geographic comparisons become particularly troublesome when they involve different countries. Differences in language, culture, and social structure make international comparisons tricky, even when they seem straightforward.”
Before we dig into specifics, here are some questions to test a comparison:
- Will your audience understand the reference?
- Does the comparison distract by making the reader do too much work to understand it?
- Is the comparison culturally dependent?
Test examples by asking your friends, family members, or colleagues whether it makes sense to them. Also, be sure to verify any measures you find online by doing the math offline.
Going the Distance
Distance can be expressed in many ways: meters and kilometers, yards and miles.
But how do you put those distances into perspective? One of the most common ways to describe a distance is to compare it to a well-known length, like that of a sports field.
- Football/soccer fields are 105 meters long (almost 115 yards).
- US football fields are shorter: 100 yards long (91.4 meters).
In the news:
“The plan called for the Navy to sneak a nuclear-powered submarine, nearly two football fields long, into the waters off North Korea and then deploy a small team of SEALs in two mini-subs, each about the size of a killer whale, that would motor silently to the shore.” — The New York Times
“A Colorado-based startup wants to build the world’s largest cargo plane that’s about the length of a football field. Its sole purpose: to deliver giant wind turbine blades.” — Business Insider
Longer distances require longer references. You can have only so many football fields. Distances between cities familiar to readers can put a distance into perspective. Really long distances require even longer references:
- The circumference of the Earth (24,901 miles or 40,075 kilometers — more than 438,000 US football fields).
- The distance to the moon (238,855 miles or 384,400 kilometers).
- The distance to Mars (142 million miles or 228 million kilometers).
To help a US audience understand expansive Chinese train routes, the The New York Times used this example:
“China has opened 28,000 miles of bullet train routes since 2008. Routes connect every major city and hundreds of smaller cities and towns. To put its size in perspective: The system is long enough to span the continental United States more than 10 times from New York to Los Angeles.”
This piece from EarthSky used multiple comparisons to explain the distances one type of bird flies:
“North American Arctic terns fly about 24,000 miles (40,000 km) each year. That’s a distance approximately equal to the circumference of the Earth (24,901 miles). An Arctic tern can live up to 30 years. So in its life-long quest for summer, it can fly 620,000 miles, or a million kilometers. As an illustration, that’s roughly three times the distance from Earth to the moon!”
But long-time writing coach Roy Peter Clark warned against comparison clichés. “Good writers are capable of so much more,” he writes. Tired analogies like the football field often don’t consider the audience to whom ‘football field’ might mean different things. They also can lose impact because we see them so often.
In the Heights… and Depths
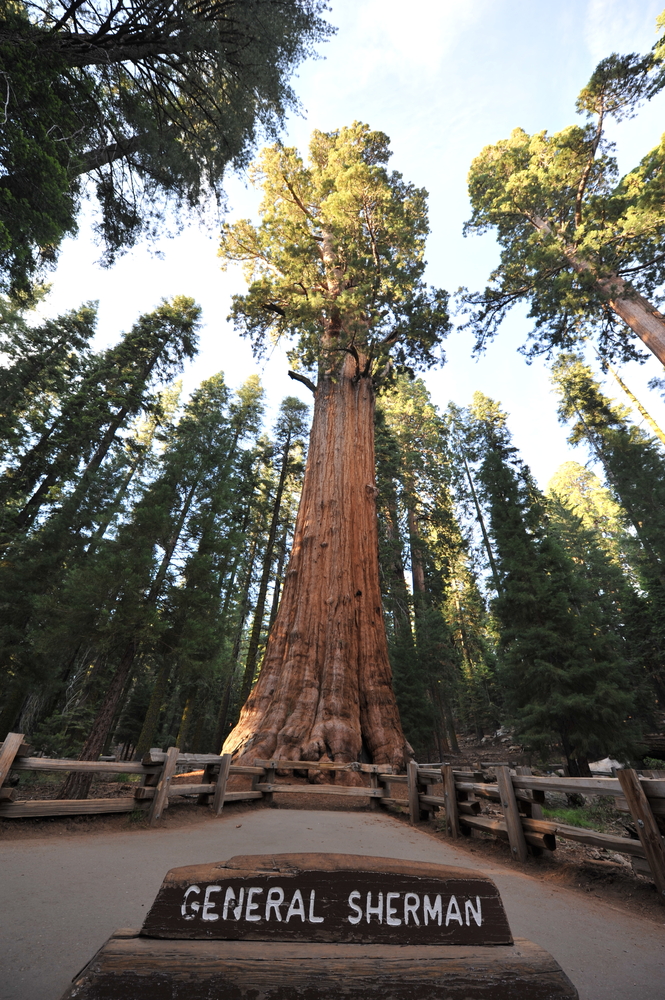
The General Sherman giant sequoia in California. Image: Shutterstock
Heights are often compared to famous structures or natural features. This is one comparison where the audience is important because certain structures might be more familiar to them:
- Mount Everest: 8,849 meters or 29,032 feet.
- Dubai’s Burj Khalifa: 828 meters or 2,717 feet.
- Kuala Lumpur’s Petronas Towers: 452 meters or 1,453 feet.
- The Eiffel Tower: Now 330 meters or 1,083 feet after a new radio tower was added in 2022.
- General Sherman, the giant sequoia that holds the record as the world’s largest tree: 83.8 meters or 275 feet
- A basketball hoop: 10 feet or a little over 3 meters.
In the news:
“The turbines would rise 240 to 300 metres above sea level — making them nearly as tall as the Eiffel Tower at 330 metres.” — The Brussels Times
“The Huajiang Grand Canyon Bridge in Guizhou province is now the tallest bridge in the world…it rises 2,050 feet above the Beipan River…almost twice as high as the Eiffel Tower in Paris and nine times as high as the Golden Gate Bridge in San Francisco.” — Economic Times
“…the Challenger Deep extends about 35,876 feet (10,935 meters) below the surface. That makes it about 7,000 feet (2,100 meters) deeper than Mount Everest is tall.” — LiveScience
Area
Two-dimensional spaces are often compared to sports fields.
“Unlike US football fields that are the same size at every playing level (5,300 square meters or 6,400 square yards), soccer pitches vary in size. FIFA, the sport’s governing body, recommends that professional fields be 105 by 68 meters or 115 by 74 yards. That’s an area of 7,140 square meters or 1,110 square yards.” — Sports Illustrated
“The world lost the equivalent of 18 soccer fields of forested land every minute.” — The New York Times
“Researchers have claimed that an asteroid, three times the size of a football field, is hurtling towards Earth and can possibly make an impact in 2068.” — Khaleej Times
“Not logging 1.8k football fields of forest will protect Orang Asli, wildlife.” — Malaysiakini
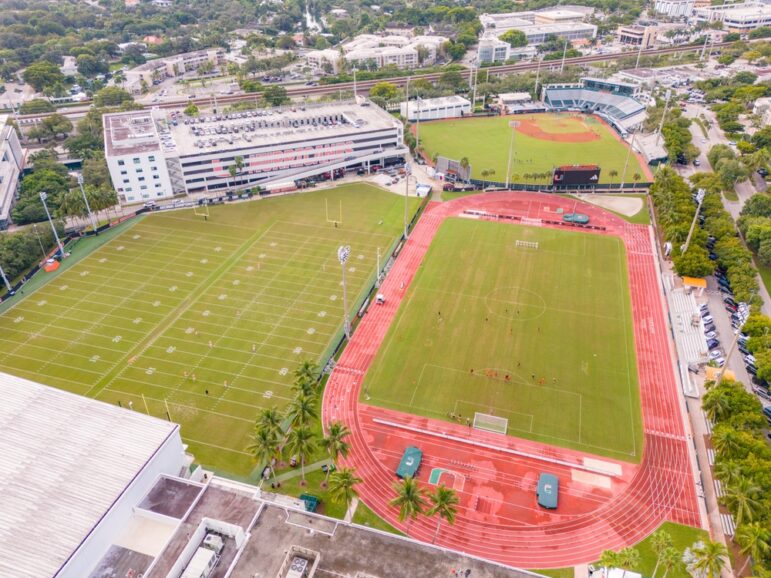
American football fields (left) and soccer pitch (right) at the University of Miami, Florida. Image: Shutterstock
Using the sizes of geographical areas familiar to your audience also can help with spatial perspective.
“According to the European Space Agency (ESA), the icy giant [A68a iceberg] has lost at least two chunks during its long journey, prior to which it was roughly twice the size of Luxembourg.” — DW.
“More than 29,000 acres, about twice the size of Manhattan, have burned in different patches in and around Los Angeles.” — The New York Times
“The world’s largest iceberg — a colossus measuring more than two thousand square miles, or about the size of Delaware — broke off West Antarctica, in 2017.” — The New Yorker
At 141 square miles, the Gaza Strip is about the same area as Las Vegas and roughly twice that of Washington, DC. Newsweek produced a series of maps that compare the Gaza Strip to some of the world’s major capital cities.
As Small As…
Tiny objects often get compared to a grain of sand, the width of a human hair, or the head of a pin.
These are familiar points of comparisons, even if we don’t automatically know their exact sizes. But in case you were wondering, here’s the breakdown:
Sand: “The size of a grain of sand can vary widely. The scientific Unified Soil Classification System used in engineering and geology corresponds to US Standard Sieves, and defines sand as particles with a diameter of between 0.074 and 4.75 millimeters.” — Wikipedia
Strand of hair: “The average human hair is 0.008 centimeters to 0.01 centimeters wide. A piece of paper is about the same width as a strand of your hair.” — Columbia Daily Tribune
Head of a pin: The surface area of the head of a straight pin is approximately equivalent to one square millimeter, according to PC Magazine.
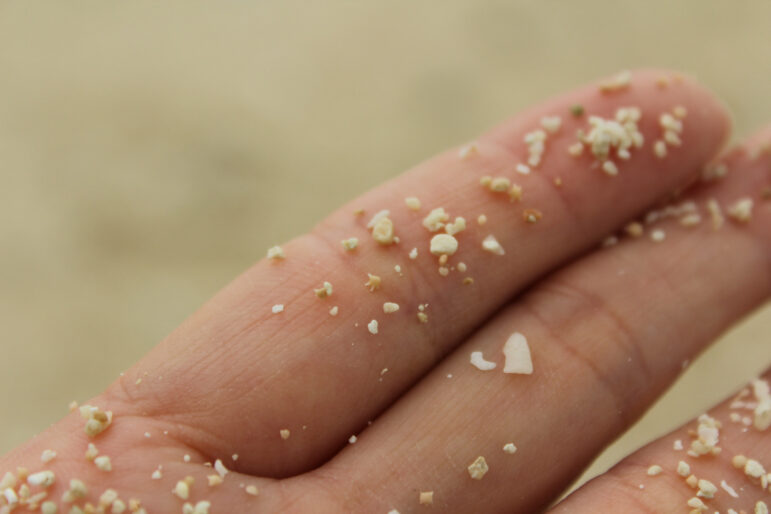
Grains of sand. Image: Shutterstock
In the news:
“Ricin is a highly toxic compound extracted from castor beans… as little as 500 micrograms — an amount the size of the head of a pin — can kill an adult.” — WGRZ
“This Lilliputian reptile [lesser night gecko] grows to only 6 cm in length (including the tail) and lays eggs weighing just 0.2 grams. While not quite being able to dance on the head of a pin, the lizard can comfortably sit atop the average fingertip.” — Birdlife.org
“‘PM 2.5 stands for particulate matter that is 2.5 microns in diameter or smaller,’ said Biskupiak. ‘To give you a better idea of how small this is, there are about 25,000 microns in one inch. For comparison, a single grain of sand is 90 microns in diameter. That size of particular matter can get into our alveoli where our oxygen exchange takes place in our lungs and that’s really what causes that damage.'” — NBC Montana
Stumped for an analogy? Keep in mind that subject-matter experts are often the best sources for comparisons.
Sometimes, standard measurements may not be necessary, as long as readers understand the reference:
“Ice chunk as big as a human rips through roof; where did it come from?” — USA Today
“…the European Space Agency said a satellite — weighing as much as an adult male rhinoceros — made an uncontrolled return to Earth, reentering the atmosphere over the north Pacific Ocean between Alaska and Hawaii. Most of the satellite burned up as it reentered Earth’s atmosphere.” — CBS News
“The blue whale is the largest animal on Earth. It can grow to 108 feet (33 meters) in length and weigh as much as 200 tons — the weight of 30 elephants.” — Monterey Bay Aquarium
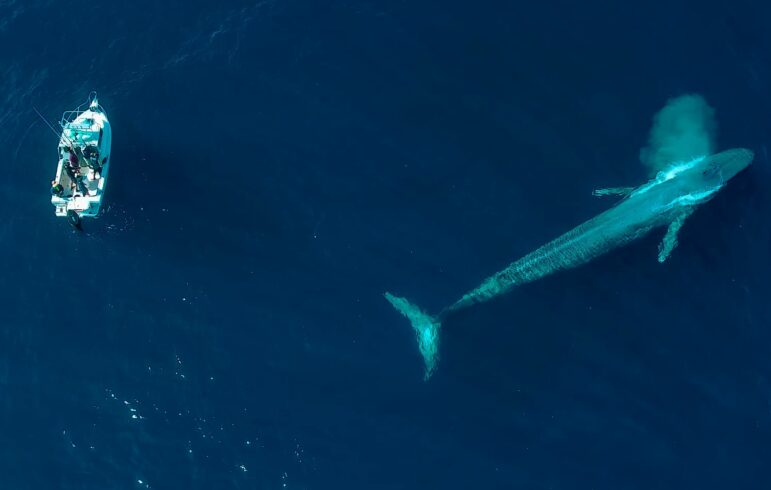
A blue whale surfaces near a boat, offering a unique perspective of the ocean’s vastness and marine life. Image: Shutterstock
Objects of Unusual Size
Hail, the frozen precipitation normally the size of a pea or smaller, has been known to come in dangerous sizes comparable to golf balls, baseballs, and even grapefruit.
In the 2023 Half Moon Bay, California, pumpkin contest, the 2,749-pound winning entry was compared to the weight of an adult male walrus. The second place winner compared his giant gourd to the size of a Smart car. — USA Today
As the giant balloon of Smokey Bear floated in the 2025 Macy’s Thanksgiving Day Parade in New York City, NBC News’ Savannah Guthrie noted that the balloon was so big that 85 actual black bears could fit inside it.
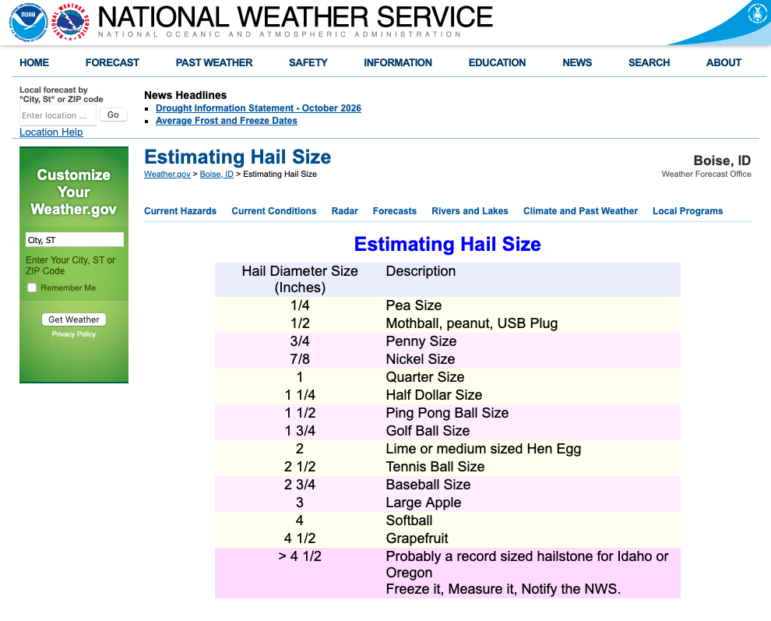
Image: Screenshot, National Weather Service
Enough to Fill…
A common volume measure used by journalists is an Olympic-sized swimming pool, which is usually defined as 2,500,000 liters or 660,000 gallons.
In the news:
Researchers said [Hurricane] Lala dumped an extraordinary volume of water across the state — equivalent to 1.9 million Olympic-size swimming pools — when it passed south of Hawaiʻi as a hurricane and tropical storm. — Hawaii News Now
“A 500-foot-thick piece of metamorphic rock, about a third of a mile wide and long, fell and triggered a massive landslide. Rock and ice, enough to fill 10,000 Olympic-size swimming pools, let loose as fast as 47 meters per second and ran for more than a mile.” — The Washington Post
But not everything needs to be about swimming pools. Often using well-known buildings or natural features can make the point.
In the news:
Vox illustrated the 1.39 billion-pound surplus of cheese held by the US government: “Extrapolating from the density of this popular brand of cheddar, 1.39 billion pounds of cheese would roughly take up 900,303 cubic yards. That’s a mountain of cheese, comparable to the size of the U.S. Capitol Building.”
“Over the last 25 years, melting Antarctic ice has added nearly 3 trillion tons of water to the ocean, enough to fill Lake Erie six times over.” — PBS NewsHour
In 2008, a crew for the documentary “Chasing Ice” watched part of the ice wall collapse in a roar of thunder and white. The chunk was larger than 3,000 Egyptian pyramids. — The Post and Courier
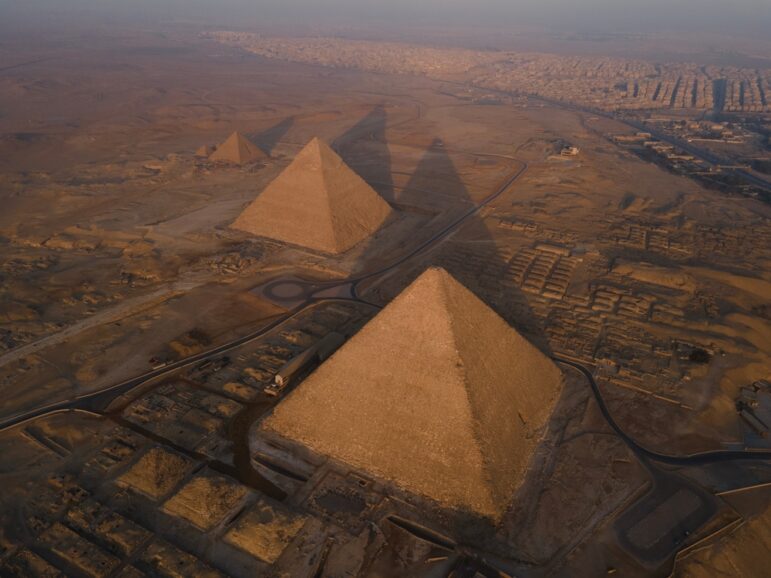
Egyptian pyramids in Giza. Image: Shutterstock
Even with smaller amounts, a point of reference can help readers.
“It takes about 1 liquid ounce of sunscreen to properly cover most swimsuit-clad adult bodies. If you have no idea what that amount looks like, it’s roughly 2 tablespoons, or the amount that would fit into the cupped palm of a medium-size adult hand.” — The New York Times
Perhaps more complicated are minute proportions, such as for chemicals. Here, again, enters the swimming pool.
In the news:
The US limit on “forever chemicals” (PFAS – per- and polyfluoroalkyl substances) is 5 parts per trillion for one PFAS compound and 10 ppt for multiple PFAS, according to Consumer Reports. “For context, 1 ppt is the equivalent of one grain of sand in an Olympic-sized swimming pool, according to some estimates.”
“For every one person who has measles, 12 to 18 other people will be infected. This makes measles around 12 times more contagious than influenza, six times as contagious as Ebola, and twice as contagious as Covid-19.” — UNICEF
Simplify
When amounts are large, simplifying the numbers into per-person or per-household terms can put things in perspective.
“If all people consumed as much as the population in the EU and OECD countries, 3.3 Earths would be necessary to support them, conclude the scientists from the UNICEF research centre Innocenti. It added that in Germany the consumption of resources is too high: ‘The lifestyle of Germans would require 2.9 Earths on a global scale.'” — Tagesspiegel
“Every year, companies around the United States capture around 18 million metric tons of carbon dioxide from natural gas processing plants, oil refineries and power plants. As long as that CO2 — equivalent to around 4 million cars on the road for a year — is buried somewhere deep underground, it can’t contribute to global warming.” — The Washington Post
“In six years, drug wholesalers showered the state with 780 million hydrocodone and oxycodone pills, while 1,728 West Virginians fatally overdosed on those two painkillers…The unfettered shipments amount to 433 pain pills for every man, woman and child in West Virginia.” — Charleston Gazette-Mail
In his Jan. 18, 2025 column reviewing the best of 2024, Nicholas Kristof of the New York Times put some good news in perspective:
“…every day over the past couple of years, roughly 30,000 people moved out of extreme poverty worldwide…”
“Now we’re approaching 90 percent literacy worldwide, and the number of literate people is rising by more than 12 million each year. Every three seconds, another person becomes literate.”
Probability/Risk
Your chances of being struck by lightning are less than one in a million in a given year. The odds of being struck in your lifetime are 1/15,300, according to the US National Weather Service.
But the probability may change, depending on where you live.
In “Numbers in the Newsroom: Using Maths and Statistics in News,” Pulitzer Prize-winning US data journalist, professor, and author Sarah Cohen writes about how to calculate the risk of being struck in Tampa, Florida, where about 20 people a year are hit by lightning. At the time the book was published, 2.5 million people lived there. So in a year, the probability of being struck there was: 20 [divided by] 2,500,000 or 0.000008. “That’s a hard number to talk about,” Cohen says. “So most people would simplify it by talking about 1 in something.”
To get that “something,” divide 1 by your answer. “So the probability of being struck by lightning is one out of 125,000.”
Using 2023 data, the National Safety Council published a breakdown of the risks. Using 2024 data, the National Safety Council published a breakdown of the risks. Among them in the US: dying in a car crash is 1 in 101, dying in a plane crash is too small to calculate, and choking to death on food is 1 in 2,367.
Again, these could change depending on the context. The odds of anyone dying from a bee or wasp sting is 1 in about 41,000. But it could increase among people with more exposure. The risk of being in a plane crash, for instance, is much higher for people who fly in Alaska where, according to ProPublica, 42% of deaths from US plane crashes involving small commercial aircraft occur, driven by factors such as mountainous terrain, unpredictable weather patterns, and limited safety infrastructure.

A bush plane flying over the Wrangell Mountains in St. Elias National Park & Preserve in Alaska. Image: Shutterstock
Energy
As our demand for energy increases and we continue to build more data centers to support AI, it’s important to put measures in perspective for readers.
In the news:
A report from the Lawrence Berkeley National Laboratory attempted to measure what AI’s proliferation might mean for energy demand: “Data centers in the US used somewhere around 200 terawatt-hours of electricity in 2024, roughly what it takes to power Thailand for a year.” — MIT Technology Review
“A typical 3 [megawatt] wind turbine can be expected to generate about 27,500 megawatt hours (MWh) of clean electricity over the course of its 25 year life. So how much coal would you need to burn in a power plant to generate that same amount of electricity? 154,494 tons.” — Distilled
But what does that mean for a household or person? According to World Bank data on per capita electricity usage, Iceland, Bahrain, and Norway top the chart, with Chad, Haiti, and South Sudan at the bottom.
Family Handyman, a US home-improvement magazine around since the 1950s, outlines costs for a variety of household appliances and offers some comparisons: “You could run a ceiling fan eight hours a day all year long, and you’d still use less energy than the air fryer at two hours a week.”
Money
Understanding large amounts of money and how much that money could buy are important perspectives that help readers, listeners, and viewers navigate complex stories.
Perhaps more useful is to explain what that money can buy or its purchasing power.
The Big Mac Index is a price index published by The Economist as an informal way of measuring the purchasing power parity (PPP). The index compares the relative price worldwide of the Big Mac, a hamburger sold at McDonald’s restaurants.
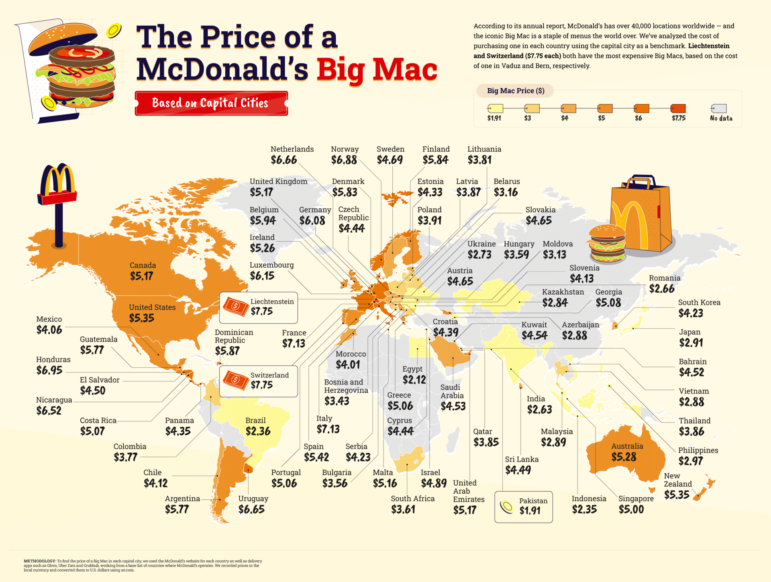
The Big Mac index, November 2022. Image: Wikipedia Creative Commons
Wealth Inequality
In the US, the racial wealth gap has continued to widen.
Recent figures estimate that Black families have about 15 cents for every dollar held by white families, which is lower than it was in the 1990s.
Another gap, the difference in pay between men and women has narrowed, but women in the US still earn about 85% of what men earn, according to the Pew Research Center.
Sweden has narrowed the gender gap. There, women earn 90% of what men earn on average.
Another form of wealth inequality is faced by low-income families whose buying power is proportionally less because they spend a greater percentage of their income on basic needs.
“Imagine a ten-mile race in which contestants have different starting lines based on parental education, income, and wealth,” wrote Chuck Collins in The American Prospect. “The economically privileged athletes start several hundred yards ahead of the disadvantaged runners. Each contestant begins with ten one-pound leg weights. The race begins, and the advantaged competitors pull ahead quickly. At each half-mile mark, according to the rules, the first twenty runners shed two pounds of weights while those in the last half of the field take on two additional pounds. After several miles, lead racers have no weights, while the slower runners carry twenty additional pounds. By midrace, an alarming gap has opened up in the field, and by the finish line, the last half of the field finishes more than two miles behind the winners.”
One contributing factor to the gender and racial wealth gaps is that white men typically hold more executive positions in companies. To illustrate this issue in Silicon Valley, the Reveal podcast from The Center for Investigative Reporting enlisted a choir to sing the disparities.
Other comparative measures that often are used to illustrate wealth or income gaps:
-
- the value of wages over time,
- executive salaries vs. the minimum wage or average wages, and
- the average compensation of different professions.
Illustrating numbers and trends can make these stories more accessible and interesting. The New York Times Magazine’s visualization Nine Ways to Imagine Jeff Bezos’ Wealth offers helpful illustrations to show his enormous wealth.
Government Spending
The raw dollar figures of government spending, millions and billions, can be incomprehensible unless put in context.
Comparisons can help paint a clearer picture.
In the news:
“…if the MGE [Myanmar Gems Enterprise] collected the taxes due on jade production, it would collect at a minimum MMK 1 trillion more than it does now. To put these figures in context, that is more than the government spent on the entire country’s healthcare last year.” — Natural Resource Government Institute
In writing about the price tag of President Trump’s border wall in 2019, Nicholas Kristof in The New York Times wrote: “the $5.7 billion could send 100,000 at-risk American kids to a high-quality preschool for a year AND provide Pell grants for 100,000 students to attend college for a full four years, with enough left over to ALSO provide a year’s comprehensive treatment to 115,000 Americans struggling with opioid addiction.”
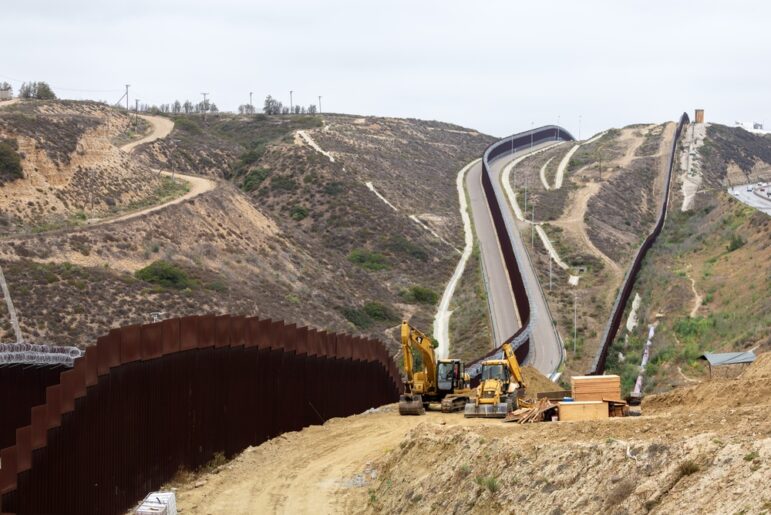
Construction of a wall on the US-Mexico border, June 2025. Image: Shutterstock
Newsweek reported on the Trump Administration’s spending bill: “The estimated price tag of the legislation is around $150 billion between now and 2029 — an annual average of $37.5 billion, which is higher than the military expenditure of all but 15 countries.”
Putting economies in perspective can help readers, viewers, and listeners understand the world’s financial power players.
At more than $30 trillion, the US is the largest economy in the world, followed by China and Germany. No. 4? It’s the US state of California. Another state, Texas, ranks 10th.
The next section will help you put some of those big numbers in perspective.
Million, Billions, Trillions
The difference in magnitude between big numbers may not seem obvious until we can illustrate it with actual objects.
Grains of sand:
- 1 million grains of sand is about the size of a sugar cube
- 1 billion grains of sand is one cubic foot and would fill a bucket
- 1 trillion grains of sand would fill 1,000 buckets
Time:
- 1 million seconds is .03 years, or almost 11 days
- 1 billion seconds is 31.7 years
- 1 trillion seconds is 31,546 years
We can apply the same technique to money. The thickness of a single one-dollar bill is .0043 inches (.11 mm)
That means:
- The height of a stack of 100 one-dollar bills is .43 inches.
- The height of a stack of 1,000 one-dollar bills is 4.3 inches.
- The height of a stack of 1,000,000 one-dollar bills is 4,300 inches or 358 feet — the height of City Tower, the tallest building in Prague.
When The New York Times was describing the development of AI systems, it wrote:
“Leading chatbot systems have learned from pools of digital text spanning as many as three trillion words, or roughly twice the number of words stored in Oxford University’s Bodleian Library, which has collected manuscripts since 1602.”
Reuters’ The Collapse of Insects illustrates how large and important the creatures are.
“…representing two-thirds of the world’s more than 1.5 million documented animal species with millions more bugs likely still undiscovered, scientists say. By comparison, there are roughly 73,000 vertebrates, or animals with a backbone from humans to birds and fish — these represent less than 5% of the known Animal Kingdom…”
Reporting on the cicada population, The New York Times wrote:
“Dr. Shockley said the dual emergence would most likely result in more than one trillion cicadas appearing in the roughly 16-state area where the two broods are generally seen…To put that into perspective, one trillion cicadas, each of which are just over an inch long, would cover 15,782,828 miles if they were laid end-to-end.
“‘That cicada train would reach to the moon and back 33 times,’ he said.”

A swarm of locusts. Image: Shutterstock
Population
Comparing population numbers requires using perspectives to which readers can relate, such as the population of a country or city.
In the news:
According to the Internal Displacement Monitoring Center: “The number of internally displaced people reached 83.4 million at the end of 2024, the highest figure ever recorded. This is equivalent to the population of Germany, and more than double the number from just six years ago.”
As the number of US Covid deaths approached 500,000, a year after the pandemic began, New York Times reporter Julia Bosman wrote: “More Americans have perished from COVID-19 than on the battlefields of World War I, World War II, and the Vietnam War combined.” — Poynter Institute
“The amount of food wasted worldwide could feed more than a billion people.” —New York Times
Use caution when searching online (or using AI tools) for comparisons. For example, some websites list metropolitan areas for cities, while others list populations based on city boundaries. Tokyo is often cited as the most populous city in the world, but that includes the surrounding area or metropolitan statistical area. Official sources such as statistics ministries typically will be most accurate.
To put numbers in perspective and make fairer comparisons, we use per capita or per person. In 2024, for example, Norway’s GDP per capita was almost $87,000 US dollars. In Uganda it was a little more than $1,000.
For measures that are lower than the number of people, such as homicides, we report per 100,000 or per 10,000. In 2024, the homicide rate per 100,000 in St. Louis was 54. The second-ranked city, New Orleans, had a rate of 35.
But use caution when numbers or populations are small. The authors of this scientific paper, “The Fallacy of Global Comparisons Based on Per Capita Measures,” warn that per capita rates overestimate values in small populations.
With very small populations, it is sometimes better to report the raw number rather than the rate. Talking with experts can help you determine how to best represent your numbers.
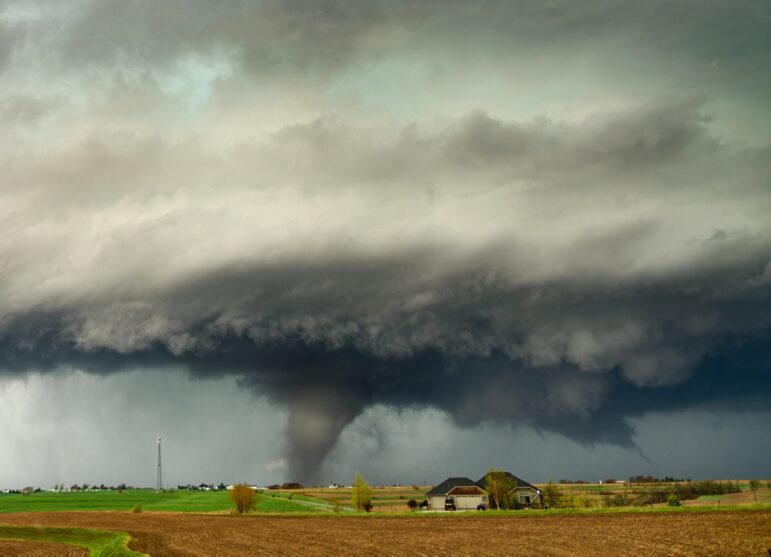
For rare phenomenon or small populations, it’s often more accurate to report the raw number rather than the percentage change. Image: Shutterstock
Tools
If you’re looking for more ideas or how to compute some standard measures, several online tools can help. Here are a few examples:
- The Dimension Guide: “An ongoing reference database of dimensioned drawings documenting the standard measurements and sizes of the everyday objects and spaces that make up our world.”
- The Calculator Site: A collection of calculators on everything from mortgages to baking.
- Mapfight: Compare the size of countries, regions, and cities.
- The Culture Factor Country Comparison Tool: Compares country sizes.
- Land Area Calculator: Common measurement units used in India.
- The Measure of Things: A search engine for comparative measurements.
- Compare Sizes and Social Compare are tools for comparing sizes of everyday objects.
- The True Size Of …: Drag and drop countries around the map to compare their relative size.
- These and other tools are included in Mihir Patkar’s guide, See True Size: Measure or Compare the Real Sizes of Anything.
Videos and Readings
- Poynter senior scholar Roy Peter Clark on the apt analogy.
- The YouTuber channel 2-Minute-Classroom offers a video that puts one million in perspective.
- This 1977 video from Charles and Ray Eames provides interesting perspectives from the expanse of the universe to the smallest things in existence, all from a picnic in the park.
- Thinking in Millions: How to Conceptualize Numbers into the Millions, Billions, and Trillions, a post by trader and MIT graduate Eli Williams.
- Methods of Comparison, Compared, by Mike Bostock, the founder of Observable, a company offering lightweight documents for code, data, and visualizations.
- If Earth Was a Grain of Sand, by engineer Clay C. Edgar
- Mastering Figurative Language: A Guide to Metaphors, Similes, and Analogies, by Maribel Leddy, a New York City-based writer and author of the Facts of Fiction blog.
- What’s the Difference Between Metaphor, Simile, and Analogy? a MasterClass.
Find the quiz here.
GIJN welcomes suggestions for more examples and tools. Email hello@gijn.org to let us know.
 Jennifer LaFleur is a data journalist, editor, and long-time teacher of data journalists, and joined the Graduate School of Journalism faculty at the University of California, Berkeley, in August 2023. At Berkeley Journalism, LaFleur is charged with broadening and deepening training in data journalism, including helping students in every medium strengthen their stories by relying on quantitative analysis and deep data-driven research. She teaches data journalism courses and works with newsrooms. LaFleur was formerly a senior editor at the Center for Public Integrity, an independent, nonpartisan and nonprofit newsroom that focuses on investigating inequality.
Introduction to Investigative Journalism: Data Journalism

Behind the Data — Tools and Techniques from the 2025 Sigma Award Winners

Open Source Databases by Country

GIJC23 – When the Data Aren’t There: Building Your Own Datasets

Test Your Data Visualization Skills With GIJN’s Latest Quiz
Think You Know Your Data Visualization? Take GIJN’s Quiz to Find Out
From Relationships to Ranking: Angles for Your Next Data Story
No Coding Required: A Step-by-Step Guide to Scraping Websites With Data Miner

Basic Data Journalism Tips for Editors

This work is licensed under a Creative Commons Attribution-NoDerivatives 4.0 International License
Republish our articles for free, online or in print, under a Creative Commons license.
Republish this article
This work is licensed under a Creative Commons Attribution-NoDerivatives 4.0 International License
Read Next
Data Journalism Teaching & Training
Test Your Data Visualization Skills With GIJN’s Latest Quiz
GIJN Turkish Editor and data journalism instructor Pinar Dag is back with another quiz to test your knowledge of data visualization.
Data Journalism
Think You Know Your Data Visualization? Take GIJN’s Quiz to Find Out
From Wikileaks to the FinCEN files, huge stories have made use of data visualizations to engage their readers and simplify complicated topics. But while data journalism is a powerful tool for investigative journalists, the vast possibilities of this world are wasted if reporters cannot effectively communicate the data they have found to the reader. To test your knowledge, GIJN has created an annotated quiz so readers can assess their current knowledge and understand the mistakes we all make while creating data visualizations.
Data Journalism
From Relationships to Ranking: Angles for Your Next Data Story
British data journalism instructor Paul Bradshaw analyzed 100 pieces of data journalism and identified seven common story angles. Here, he uses real-world examples to show how common angles can generate useful story ideas, and the strategies and considerations that reporters should keep in mind.
Guides Tipsheet Data Journalism GIJC23
No Coding Required: A Step-by-Step Guide to Scraping Websites With Data Miner
Knowing where to look for data — and accessing it via scraping data from websites — can be a powerful force multiplier for investigative journalists.
Resource Tipsheet
Basic Data Journalism Tips for Editors
At the NICAR22 conference in Atlanta, Georgia, journalism trainer MaryJo Webster offered a series of basic tips for editors who have little to no data analysis skills.