
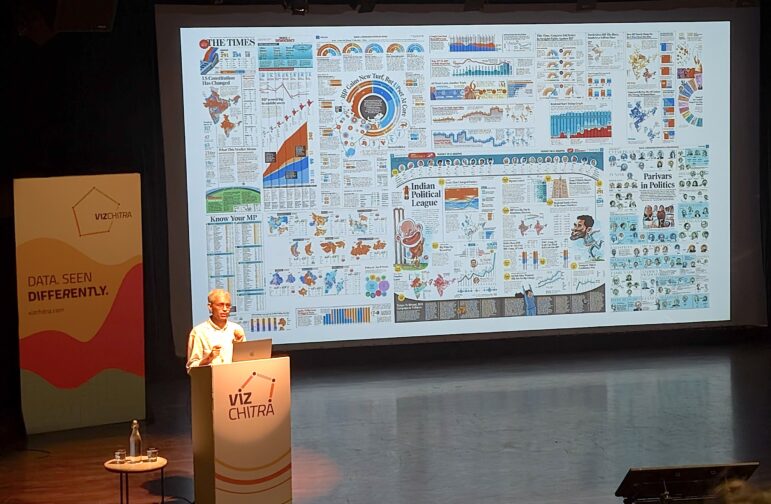
Rohit Saran, managing editor of The Times of India, speaking at the 2026 VizChitra conference in Bengaluru. Image: Courtesy of the VizChitra community
How a WhatsApp Community Is Bringing India’s Data Storytellers Together
Read this article in
A few years ago, when the COVID-19 pandemic had brought the world to a standstill, a small group of journalists, designers, researchers, developers, and civic technologists working with data in India started discussing an idea. They were not planning any online event. Mostly in isolation, they were simply trying to find one another.
In many of their newsrooms, universities, and companies, they were the only people doing data reporting or visualization. There was no common space where they could ask questions, exchange ideas, or meet others facing the same challenges. That conversation has now grown into one of India’s most active data storytelling communities.
Today, the VizChitra WhatsApp community has more than 1,600 members. Earlier this month, more than 600 people gathered both virtually and in real life — 400 of them attending in person from 55 cities across 20 states — in the southern Indian city of Bengaluru for VizChitra 2026, a volunteer-led conference on data visualization and storytelling. The audience reflected the diversity of the community itself. Journalists sat alongside designers, developers, researchers, educators, product managers, students, and data scientists.
But the conference is only a small part of the story. “We don’t call it a conference,” says Gurman Bhatia, founder of Revisual Labs and one of VizChitra’s founders. “We call it a community.” People in the community “need a place where they can ask for help,” whenever that might be, she said. That place is their WhatsApp community.
Over the years, what started as a single online group has grown into a network of specialized communities. There are groups for jobs and collaborations, educators, book lovers, D3 (data-driven document) learners, AI, sonification, feedback on visualizations, and more. Questions range from finding government datasets and cleaning messy spreadsheets to reviewing charts, sharing code and discussing careers.
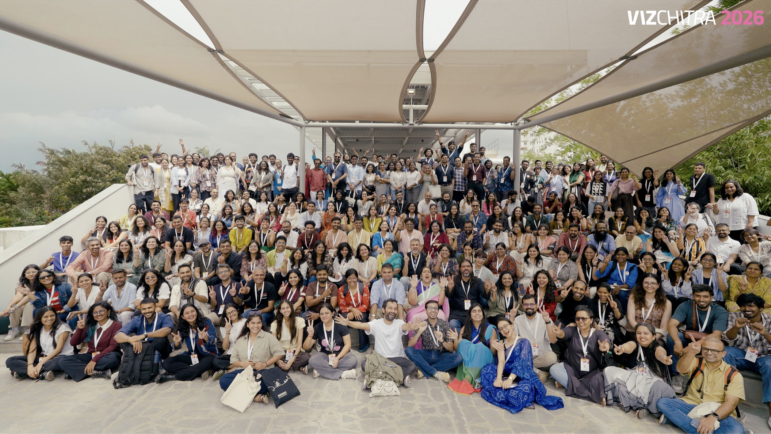
Group shot of attendees at 2026 VizChitra data conference. Image: Courtesy of the VizChitra community
The idea for VizChitra took shape during the pandemic. Bhatia and fellow organizer Rasagya Sharma had been talking about how scattered India’s data visualization community was. Around the same time, community-builder Zainab Bawa suggested organizing a conference. The first idea was to hold it online, but the group decided to wait until people could meet in person. They first reached out to just 20 or 30 people working in the field. Around 18 replied. What surprised them was that everyone was solving similar problems without knowing each other existed.
The group decided to create a WhatsApp community, initially called “DataViz Community.” Later, members adopted the name VizChitra, suggested by Arpit Arora. “Chitra,” meaning picture or image in several Indian languages, captured the spirit of the initiative. The community grew much faster than the founders expected. Before the first in-person conference in 2025, they put together an online launch event and displayed a QR code inviting people to join the WhatsApp group. Nearly 800 people signed up within 10 days. “I honestly didn’t expect so many people,” Bhatia recalls.
Many professional WhatsApp groups slowly become inactive or drift away from their original purpose. In one recent example, a member built a simple interface for India’s Time Use Survey, making a large and technically complex government dataset much easier to explore. Instead of keeping the tool private, they shared it freely with the community. “This is a public service where somebody needed help, and somebody else solved the problem for everyone,” explains Bhatia.
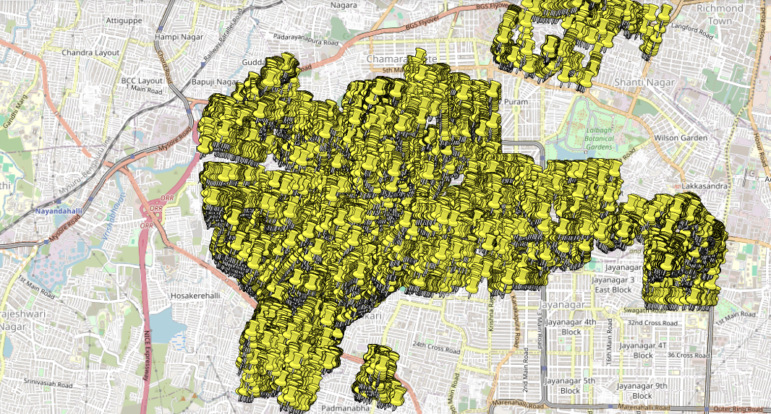
VizChitra volunteers helped map the trees missing from public records for the Bengaluru tree census. Image: Screenshot
The same spirit extends beyond journalism. In Bengaluru last year, about 20 members of the local chapter spread across a neighborhood to map trees missing from public records. Within two hours, they had added around 100 trees to an open database. For Bhatia, that captures the real purpose of the community. “Data is everywhere,” she says.
Compared to last year, this year’s gathering was much bigger, but the organizers insist that size is not the goal. “We are a diverse crowd,” says Amit Kapoor, one of VizChitra’s founders. That diversity was visible throughout the conference. No single profession dominated the audience. Climate researchers, architects, designers, economists, AI engineers, public health experts, software developers, artists, and journalists all shared the same space. Among registered participants were more than 100 product and UX designers, nearly 80 information designers, over 70 researchers and educators, and 66 journalists and communicators.
About half came from Bengaluru, while the rest traveled from across the country. Notably, nearly half had less than five years’ experience in data visualization, while more than a quarter had been working in the field for over a decade. “The journalist sitting next to a designer sitting next to a researcher, that is the whole point,” Kapoor says.
This was the idea behind the community from the outset, and it grew out of a gap he noticed while teaching data visualization. Every organization, he notes, has people who understand design and others who understand data. Very few have people who connect the two and turn data into something ordinary people can understand. VizChitra is trying to build that missing bridge. The need is particularly strong in India, where data journalism is still developing, especially in regional-language newsrooms.
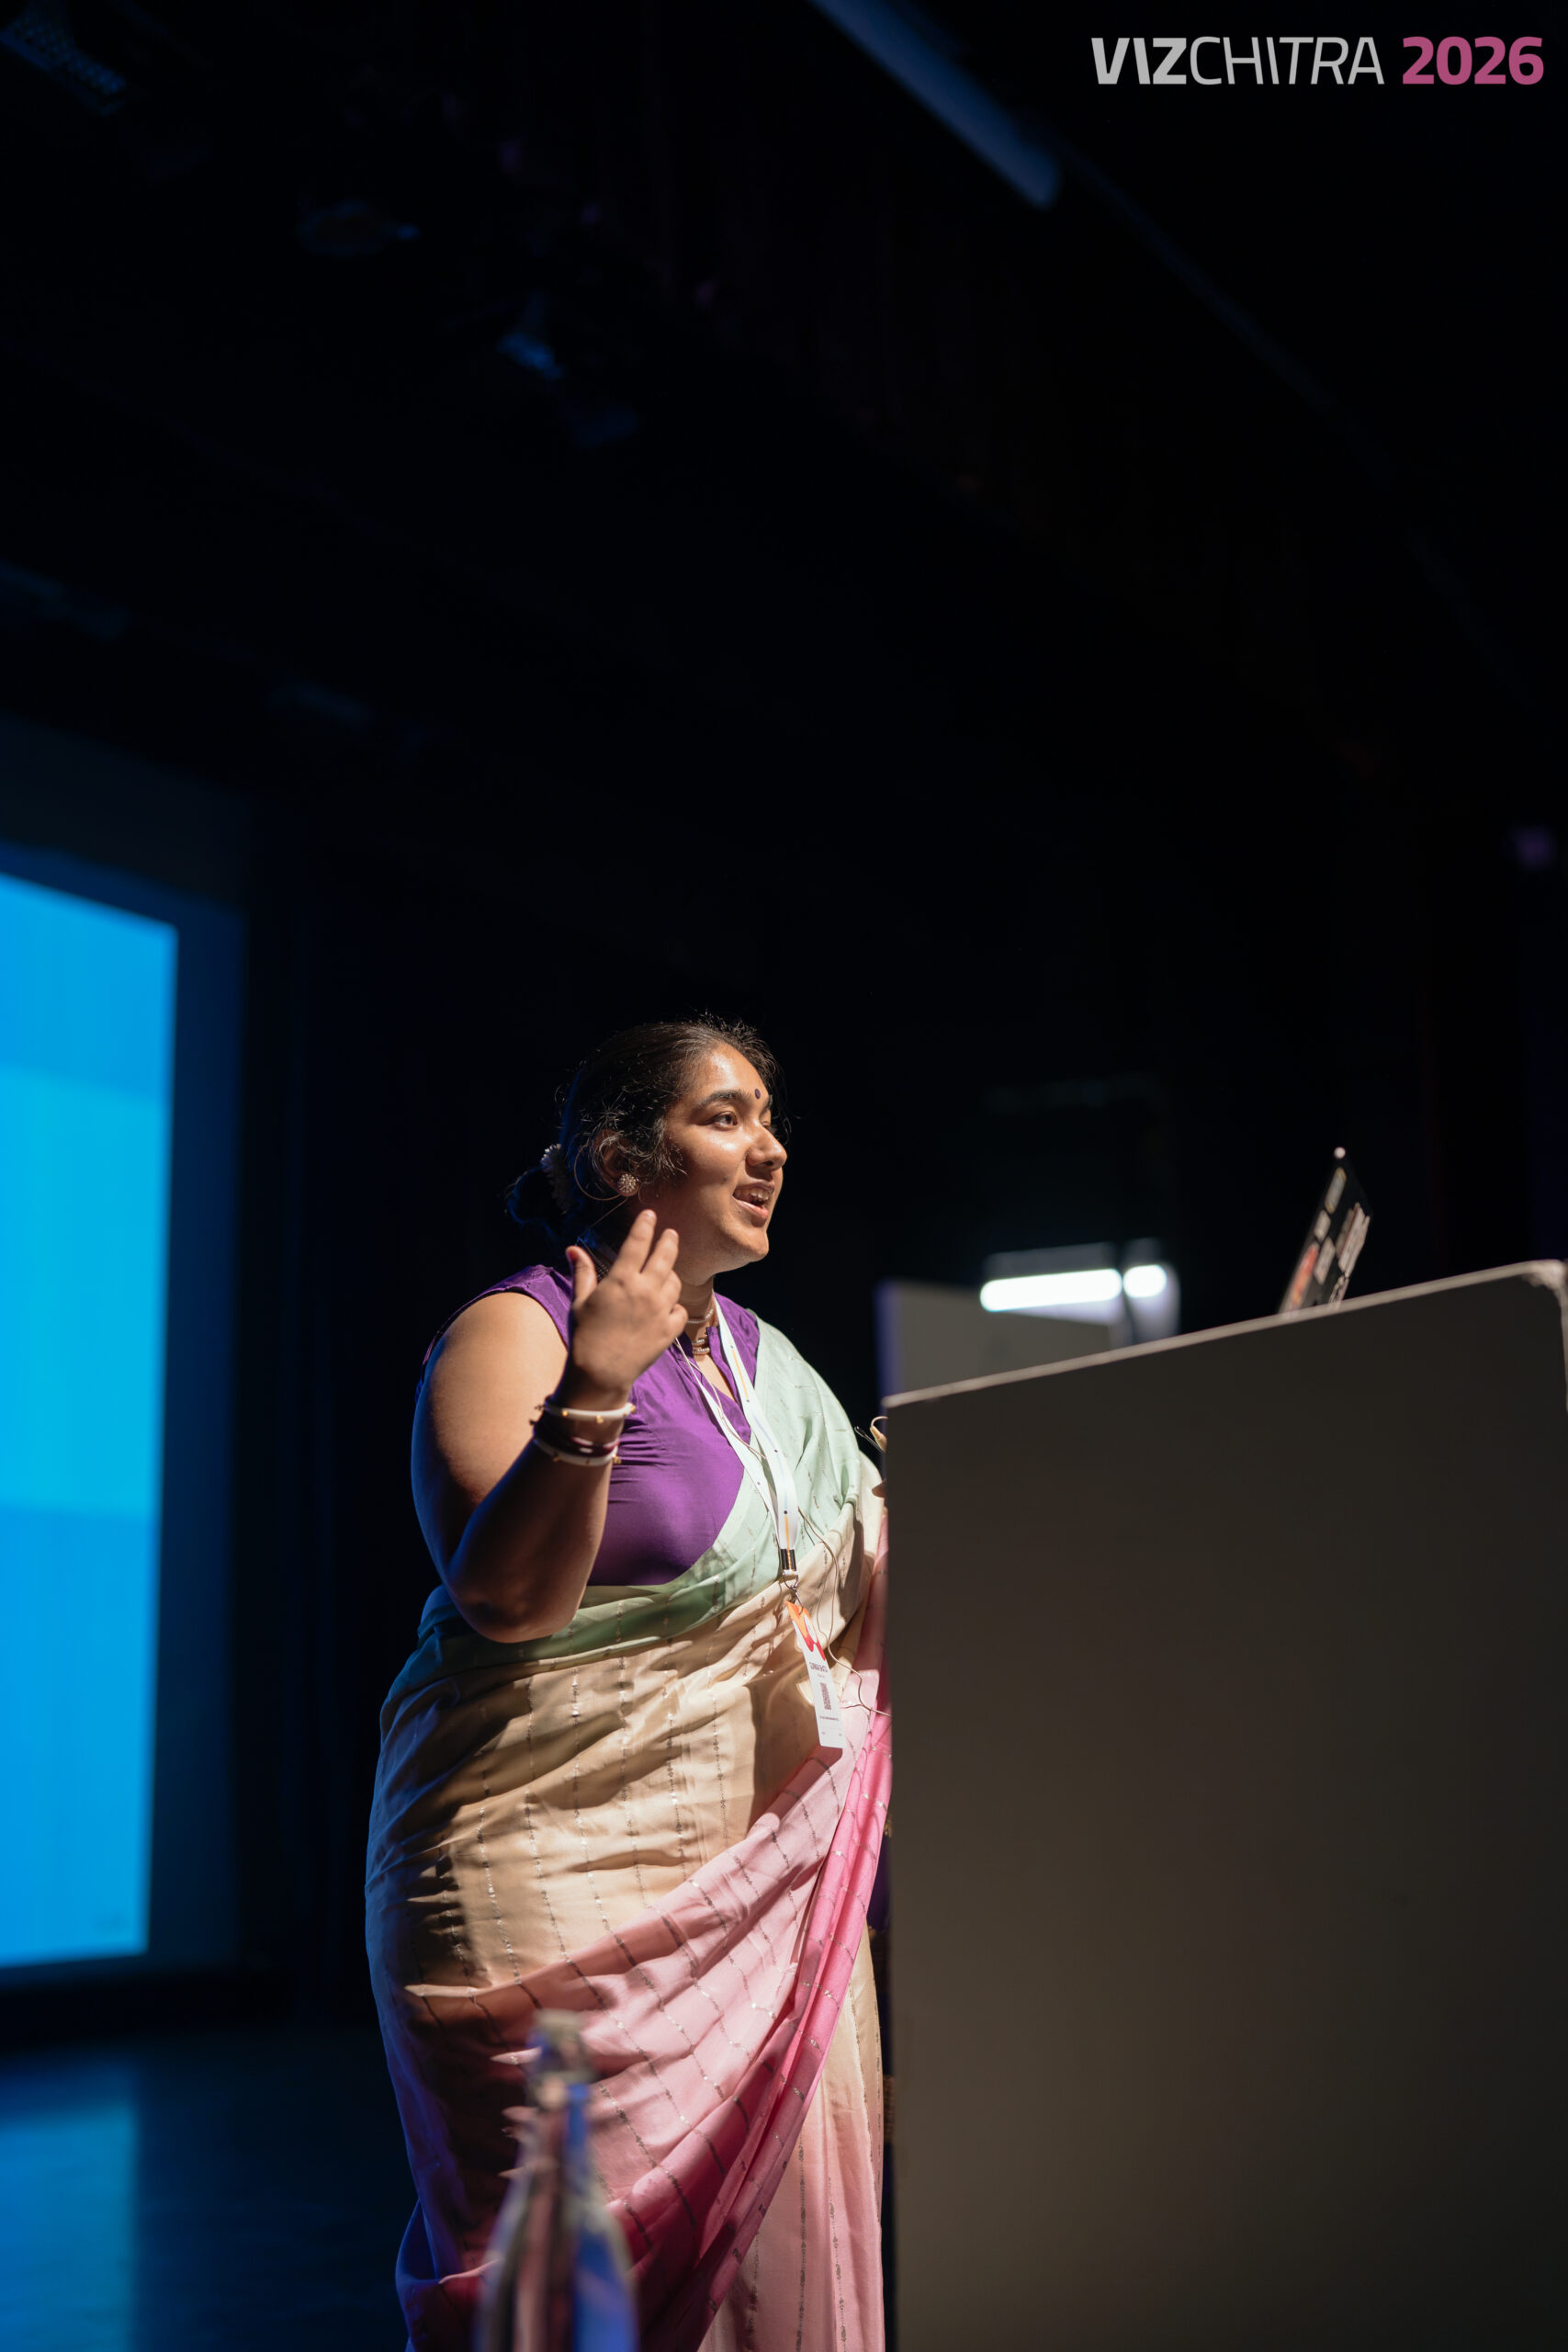
Former journalist and data visualization designer Gurman Bhatia addresses the VizChitra conference. Image: Courtesy of the VizChitra Community
Journalist and author Rukmini S says the challenge is not just about technology. While it has become easier than ever to create charts and graphics, many still struggle with the basics of data literacy and interpretation. Good visualization, she argues, starts with good reporting and a sound understanding of data.
That was a recurring message throughout the conference. Data journalism was presented not as a replacement for reporting, but as a tool to assist it. “Data should never replace traditional reporting,” says Bhatia. “The two should complement each other.”
Many sessions reflected that approach. In one of the most popular talks, “Telling Timely & Timeless Stories with Data,” The Times of India Managing Editor Rohit Saran explained how public datasets can help journalists find stories that remain relevant long after the daily news cycle has moved on. Drawing examples from his recent book “100 Ways to See India,” he showed how valuable information often lies hidden inside government reports until someone cleans, analyzes, and explains it. “Data is public,” Saran told participants, “but the public doesn’t know it.”
The organizers also experimented with the format of the event itself. Talks, workshops, exhibitions, and discussions were designed to serve different purposes rather than becoming variations of the same session.
One of the highlights was “Data, Otherwise,” a climate-themed exhibition curated by volunteers Debanshu Bhaumik and Siddharth Mukherjee. Instead of looking at charts on computer screens, visitors experienced data through touch, sound, and physical installations. One exhibit, “Puddle Beneath the Plate,” showed the hidden water footprint of everyday meals through puddle-shaped placemats. Others explored disappearing species, rising urban heat, vanishing sparrows, and air pollution. The exhibition reminded visitors that data is not just about numbers. It is also about helping people feel and understand complex issues.
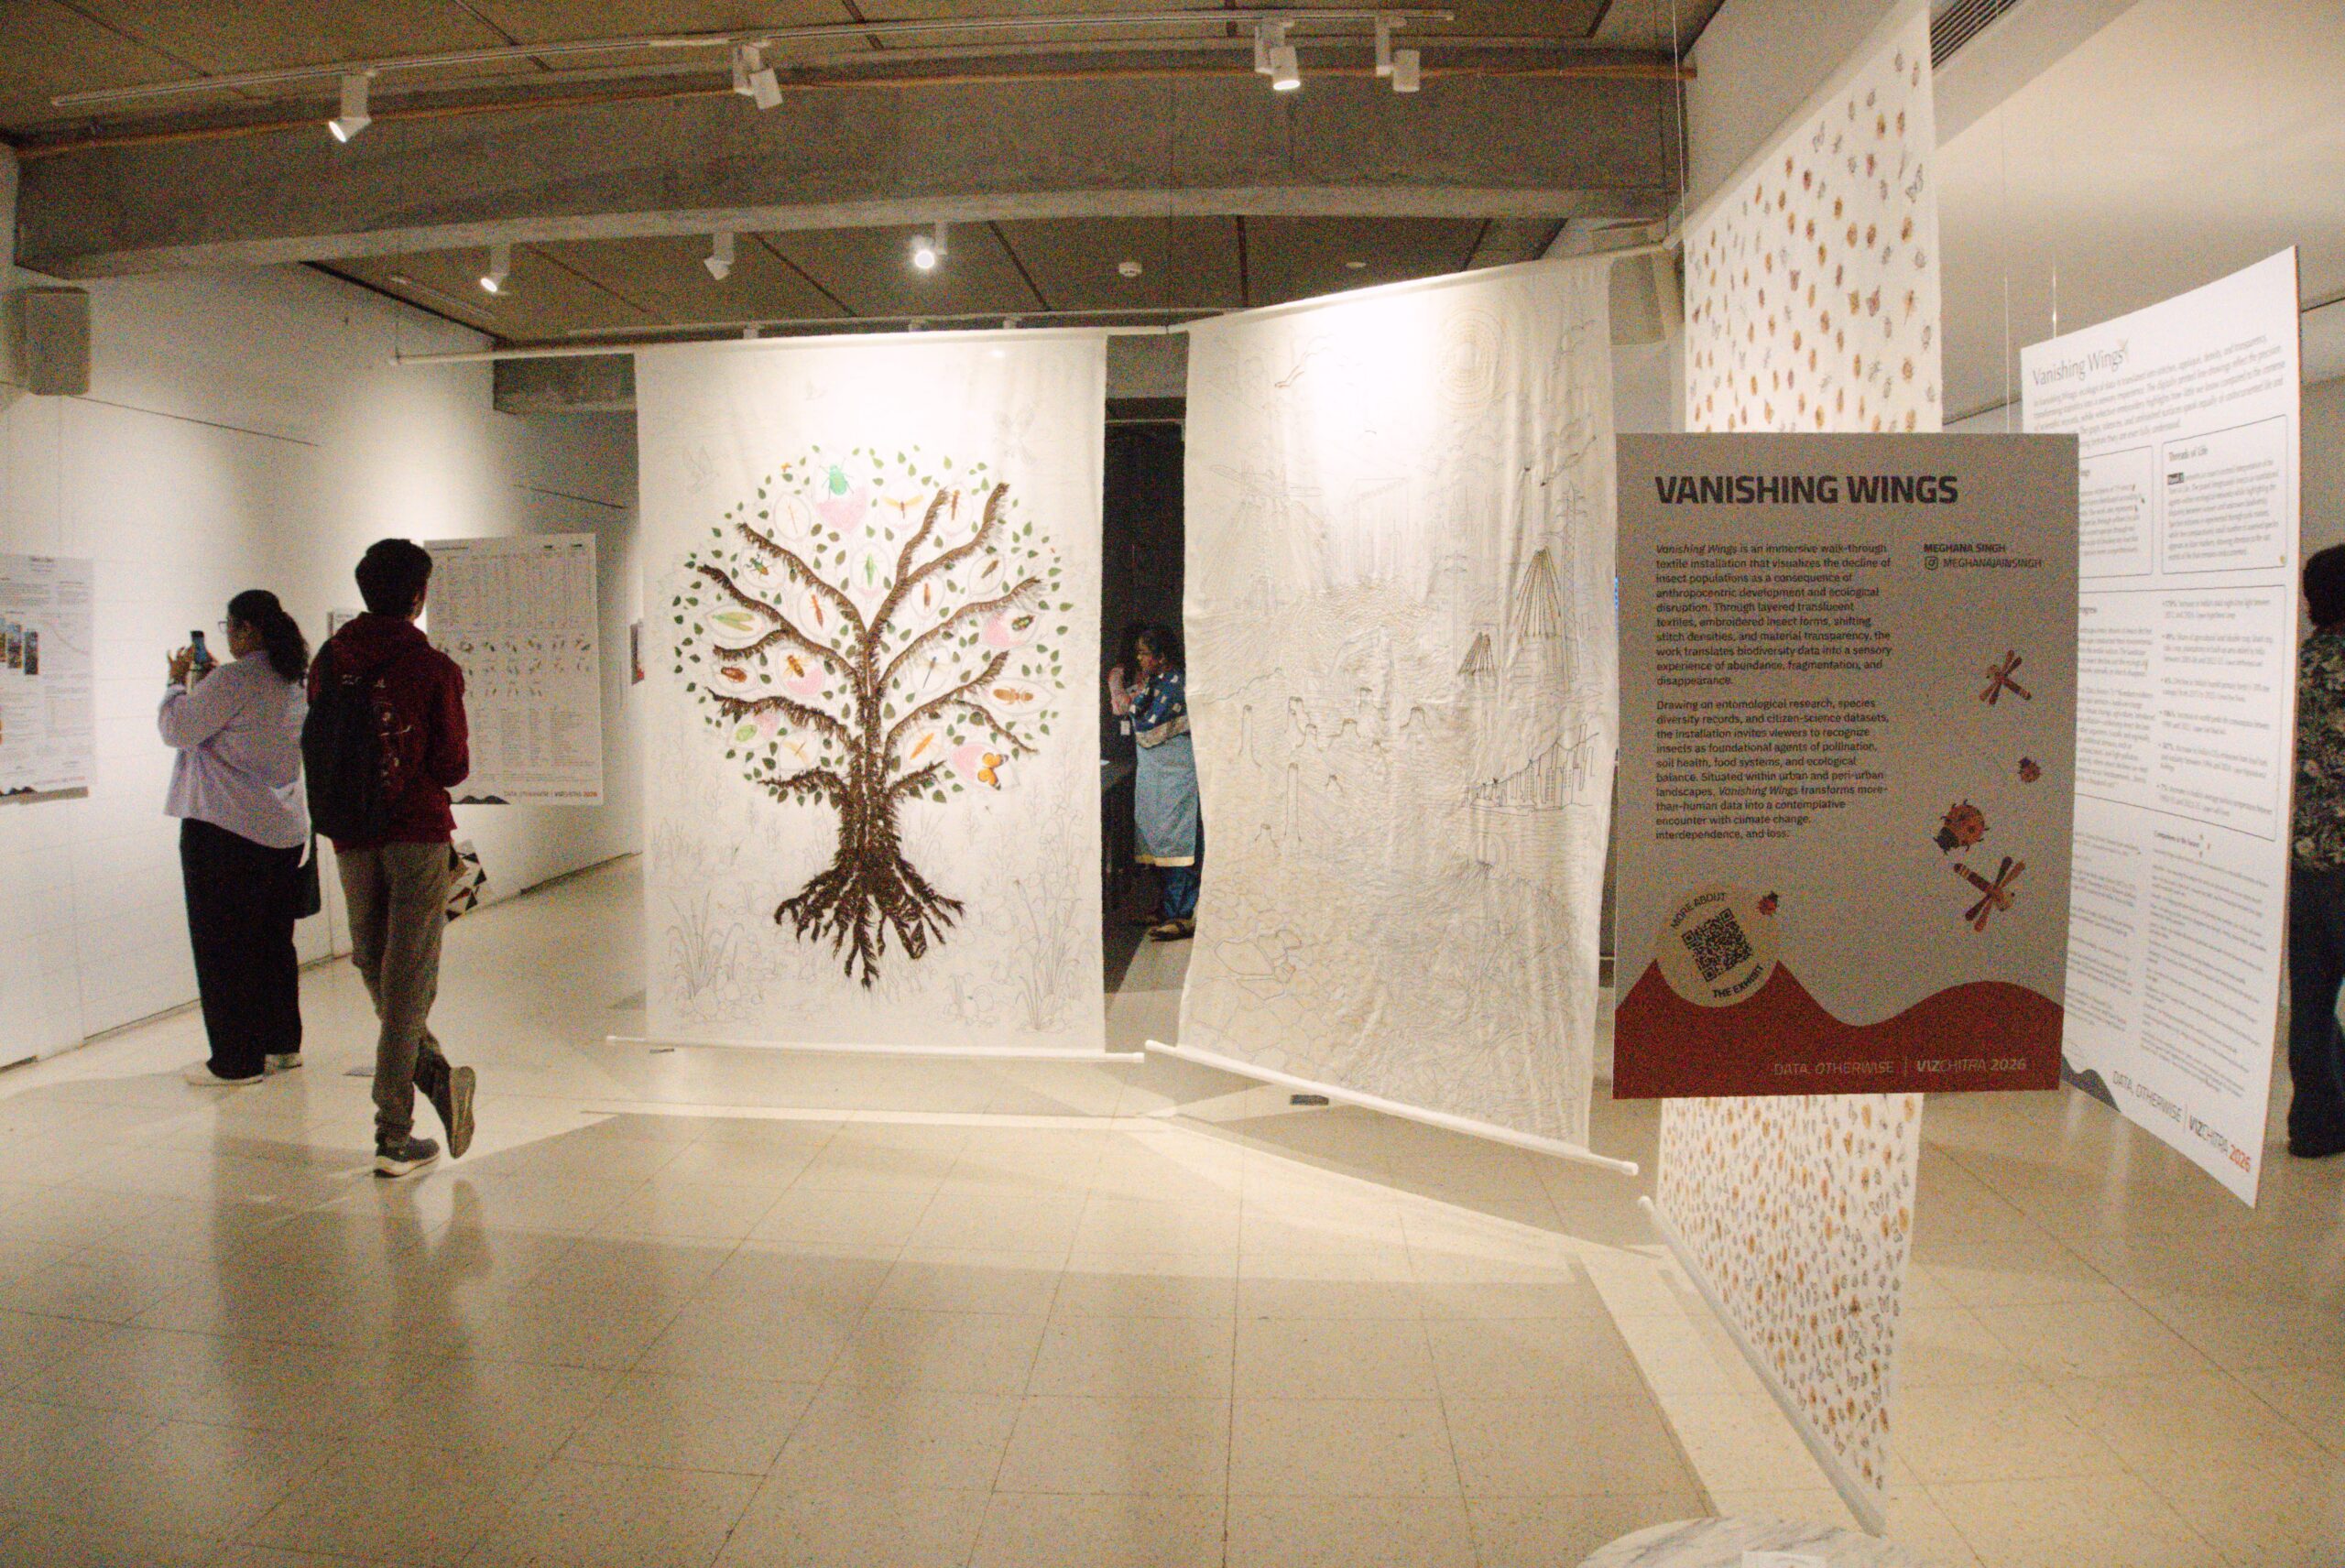
The “Data Otherwise” exhibition at the 2026 VizChitra conference. Image: Courtesy of the VizChitra Community
What makes VizChitra unusual is that almost everything is done by volunteers. The organizers all have full-time jobs. Debanshu Bhaumik first joined as a volunteer at last year’s conference. This year, he curated one of its biggest attractions, the “Data, Otherwise” exhibition. Others have taken responsibility for planning workshops, community groups, mentoring, and logistics. The organizers hope the conference will continue, but they are clear that the real value lies elsewhere.
That is perhaps why the founders are less interested in counting registrations than in seeing people help one another. Someone asks for a dataset, another shares it. Someone needs feedback on a chart, others respond. A young journalist looking for guidance finds an experienced designer. A developer builds a tool and makes it freely available. Small acts like these keep the community alive long after the conference is over.
For Kapoor, that was always the goal. VizChitra was created for people working at the intersection of data, design, and storytelling, people who often found themselves working alone. By bringing journalists, designers, researchers, developers, and educators into the same conversation, the community is trying to strengthen an ecosystem that is still taking shape in India.
Gurman pointed out that a conference may only last a couple of days. “What happens after that,” she suggests, is even more important. For the more than 1,600 members of the VizChitra community, the answer is straightforward. The conversation continues.
 Deepak Tiwari is GIJN’s Hindi Editor. He is a senior journalist and former vice chancellor of Makhanlal Chaturvedi National University of Journalism and Communication, Bhopal. With over 30 years of experience as a reporter, sub-editor, television commentator, media consultant, and managing editor of a media startup, he is also the author of two books on the political history of the Indian state of Madhya Pradesh.
Investigative Journalism in Asia: Resistance, Transformation, and Solidarity Amidst Mounting Press Challenges
Sigma Awards: 10 Lessons for Data Journalists Around the World
Guide to Investigating Caste
How Local Reporters in India Exposed the Pandemic’s True Death Toll
Digital Scam Trails, Deadly Hospital Infections, Harrowing Immigration Journeys: 2025’s Best Investigative Stories from India
My Favorite Tools: Indian Journalist and Data Designer Gurman Bhatia
What I’ve Learned: Lessons and Advice from The Caravan’s Vinod K. Jose
Editor’s Pick: Best of Data Journalism from 2025

This work is licensed under a Creative Commons Attribution-NoDerivatives 4.0 International License
Republish our articles for free, online or in print, under a Creative Commons license.
Republish this article
This work is licensed under a Creative Commons Attribution-NoDerivatives 4.0 International License
Read Next
Editor's Picks News & Analysis
Digital Scam Trails, Deadly Hospital Infections, Harrowing Immigration Journeys: 2025’s Best Investigative Stories from India
Also featuring deep dives into rampant worker injuries in automobile factories, health hazards from imported scrap tires, and the politicization of the national archaeological survey.
Data Journalism My Favorite Tools
My Favorite Tools: Indian Journalist and Data Designer Gurman Bhatia
For GIJN’s My Favourite Tools series, we spoke with Indian journalist and information designer Gurman Bhatia. She has worked at the Hindustan Times in Delhi and been a part of the award-winning team at Reuters Graphics, where she worked on visualizations for topics as diverse as election fraud in India, use of force during protests in Hong Kong, and bushfires in Australia.
10 Questions
What I’ve Learned: Lessons and Advice from The Caravan’s Vinod K. Jose
For the inaugural post in our new interview series about investigative reporters operating in tough press freedom environments around the world, GIJN speaks to Vinod K. Jose, executive editor of India’s premier long-form journalism magazine, The Caravan. He tells us about the challenges of leading an intrepid team in the face of rising autocracy in the world’s largest democracy.
Data Journalism Top 10 Editor's Picks
Editor’s Pick: Best of Data Journalism from 2025
Our roundup of standout data journalism from the past year highlights projects that delve into conflicts in the Middle East, Ukraine, and Africa, that explore the rise of AI, and interrogate global trade wars.