
Tips for Building a Database for Investigations
Read this article in

Tipsheet for Using Ocean Data in Your Investigations

What Washington is Doing in Your Country: A Tipsheet for Investigating US Influence Around the World
Free, Game-Changing Data Extraction Tools that Require No Coding Skills

Remote Sensing and Data Tools for Environmental Investigations

Credit: Julia Joppien / Unsplash
Earlier this year, as the nation of Colombia was rocked by protests, armed confrontations, and accusations of police abuse of power, journalists scrambled to keep track of events.
As the crisis escalated, several independent media and human rights organizations started building their own databases to record fatalities linked to the protests, which various NGOs tallied at more than 70 by early July. They also started to record allegations related to abuse of power, violence, and protester detentions.
One such database was designed by Rutas del Conflicto — Routes of Conflict — a digital media organization that normally uses investigative and data journalism techniques to cover Colombia’s 50-year armed conflict. Earlier this year, the group began covering violence related to the protests, which started over a proposed tax reform but morphed into more general anti-government protests.
Led by journalist Óscar Parra, a team of reporters, journalism students, a developer, and a graphic designer built a database to register deaths during the protests that rocked cities across the country.
Collecting and confirming information from daily events, press reports, NGOs, and interviews with witnesses and relatives of the victims, this team was able to create a verified database of the violence. That allowed them to map the events and explore who the victims were, while analyzing the circumstances around their deaths and exposing how police brutality was behind many of the incidents.
This was not the first time that Parra had created a database that could be used for journalism. In fact, Rutas del Conflicto was launched in 2012 when he was covering a transitional justice process in which former paramilitaries gave evidence about their role in Colombia’s war against the Armed Rebel Forces of Colombia, the FARC.
Parra realized that the hearings frequently revealed details about massacres in which civilians and enemy combatants had been killed. “So, I thought it would be good to group all that information in a database to try to create mapping tools and timelines,” he says, adding that individual stories related to each court appearance failed to build a complete picture of what was happening in the way that a map could.
Parra used his knowledge as a systems engineer — his previous career — and his passion for investigative journalism to train a group of students, and sought funding for the first stage of Rutas del Conflicto, which would go on to win the 2017 Data Journalism Award for best data journalism website.
La Paz en el Terreno — or Peace on the Ground — is a data project that examined violence in Colombia after the signing of the peace accords. Image: Courtesy of Rutas del Conflicto
The team has since followed the same steps to collect, organize, and process data on how victims of the conflict were forcibly disappeared in rivers across the country, and the relationship between violence in Colombia and land property disputes.
Newsrooms around the world are building their own databases when faced with a lack of official data, or where the available data is not reliable. Others have created them as a reporting or investigative resource while events are taking place, or when it is necessary to cross-check various sources of information.
“Not having the data you need at hand is not a reason for not telling a story you believe might be useful for the public,” says Romina Colman, an Argentinian data journalism expert and the Latin America Data Editor at the Organized Crime and Corruption Reporting Project (OCCRP).
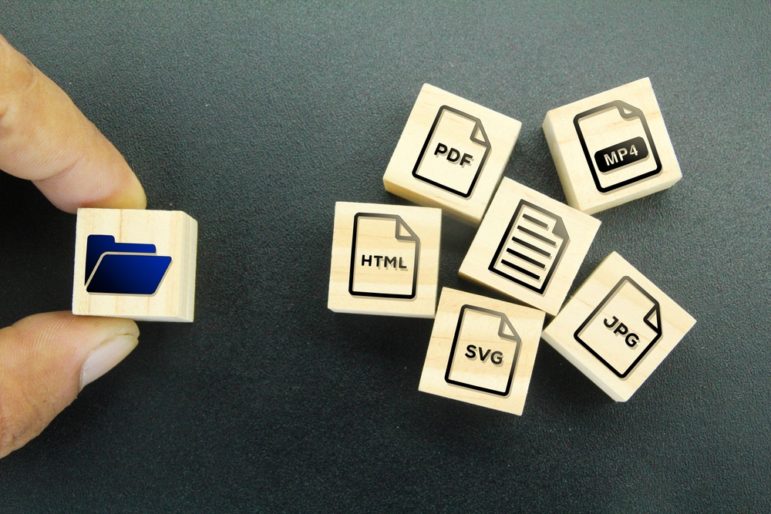
While investigative journalists may encounter information in all sorts of formats — PDF reports, messy paper records, reporters’ interviews and observations, scanned files, handwritten documents, old archives — with the right expertise they can all be transformed into processable databases.
I learned this back in 2009, when I worked on creating a database with GIJN member Consejo de Redacción (CdR), Colombia’s association of investigative journalists. We wanted to build a database for journalist partners that would help them investigate public officials and corruption. Back then, tools for extracting data from documents were scarce. Data journalism was just beginning in Colombia, and we could get only limited information in manageable digital formats from the government.
So we started by transcribing hundreds of paper documents, many of them handwritten, in which public officials declared their conflicts of interests and their campaign donors. We ended up with a collection of more than 2 million records a couple of years later, after adding other related data from over 20 official sources. That led to a number of exposés of political misconduct, like this one about dodgy land redistribution, by the leading investigative magazine Semana.
In 2011, as data management and analysis was gaining ground as a journalism technique, Colombia joined the Open Government Partnership, a global initiative signed by 78 countries to improve transparency. That allowed me and my team to continue creating databases to tell relevant stories. One delved into the connections between local comptrollers — public officials tasked with supervising the work of mayors and governors — and the very people they were supposed to be monitor. Another analyzed who financed the presidential and congressional campaigns in 2018 by cross-checking the candidates’ reports with public contracts, company registries, and historical data of local public officials.
While journalists have been building databases since the 1980’s, in recent years technology for extracting data from web pages, converting PDFs or scanned files into editable formats, and combining large amounts of data has emerged and become more accessible. A growing number of reporters have received training in what used to be called computer-assisted reporting — now known as data journalism — and collaborations between journalists and developers or computer engineers have increased, making it easier and more feasible to build databases for journalistic purposes.
Globally, newsrooms have created databases to investigate assets seized from criminals in Italy, taser deaths and police use of force in the United States, as well as to collaborate with transnational investigations. Recently, a group of journalists from 12 countries built a database with information that had never been systematized before, involving 2,460 cases of violence against environmental rights defenders in Latin America. The group subsequently published 36 investigative reports about this dataset in a special project called Land of Resistance (Tierra de Resistentes).
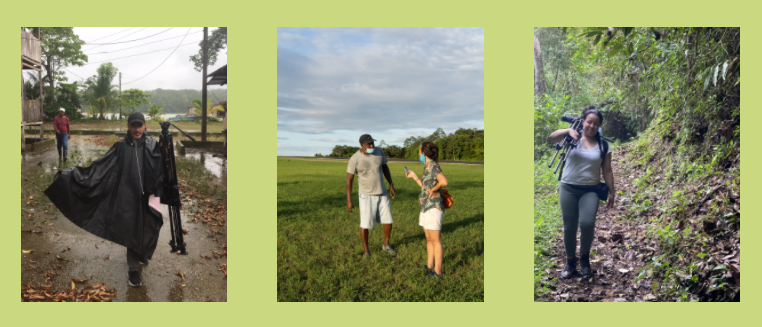
Some of the reporters from the Tierra de Resistentes project. Image: Screenshot
On the other side of the world, the OCCRP won the 2020 Sigma Award for its Troika Laundromat investigation, in which the team used cutting-edge technology to extract data for over 1.3 million transactions from hundreds of bank records. This work exposed how Russian oligarchs and politicians secretly invest their ill-gotten millions abroad, launder money, and evade taxes.
These projects are notable for having assembled data that was not publicly available or not centrally collated to narrate stories that had a huge impact, but which would not have been possible without the databases that allowed reporters to dig into the story. But investigative journalists can also create databases on a smaller scale and still have enormous impact. So here is a step-by-step guide to how to approach building databases for investigations.
1. Get Ready
- Explore the documents from which you will extract the data. See if you can identify any patterns; those repetitive elements will give you clues about how to structure your database. If you are starting from scratch and will get records from interviews and traditional reporting, analyze similar cases or stories to find common ground. It might be useful to talk to experts in this exploration stage.
- Define the scope of the data you will collect. What period will you cover? Which cases will be included, and which will you exclude? (This requires clear and extremely specific criteria). Will there be a limit to the number of records you process? The resources of your project — time, team, funds, technology, etc. — will help you answer these questions.
- Make a list of the questions you want to answer during the investigation. This will guide the design of the database.
- Encourage teamwork, especially in this initial stage. Discussions among colleagues make these first crucial stages easier and your work stronger. In fact, this was how the Tierra de Resistentes project started: the database and the investigation were shaped during investigative journalism workshops.
2. Design and Develop the Database
- Start by defining what each record (row) is going to be: cases, persons, places, products, events, countries, transactions, etc.
- Then, make a list of the elements that would help identify each record: these will be your fields (columns). For example, if each row is a person, then the fields might be name, ID number, age, location, profession, etc.
- Define a key for each record. Identification numbers are a better idea (when available) than names. You can also invent codes by combining two or three aspects that make each record unique. This key will be essential if you need to cross-check between two or more datasets.
- Besides the identifier fields, include other notes for details — usually short paragraphs that will be useful for the narrative — and others for classification, like those that refer to common characteristics and which establish categories. For these category fields, it is helpful to think about what story might come out from each of them. For example, you might include a column for “race” to analyze whether there is a pattern of racism involved in a particular dataset.
- Uniformity is paramount. So, use the validation configurations to ensure that numbers are typed as numbers, dates are in the correct format, and categories are always spelled the same way. As much as possible, make most fields multi-selection instead of open-ended questions.
- Include fields to identify who input each piece of information and what the original source is (link to it, too). This will be useful later if you need to check any of the data.
- Try not to go overboard on the number of fields. Create only the ones that will be relevant for your investigation, as well as for the data analysis, and the ones that your team will be able to fill.
- Your database may need more than one table, depending on the complexity of the topic and the relationships between the elements involved.
- Make sure the database design is user-friendly for everyone involved in the project, no matter their technology level. “It should be a tool built especially for journalists and with journalists,” says Paul Radu, co-founder and chief of innovation at OCCRP.
- Make the database scalable: your design might be the first step of a future bigger project, whether by you and your team or someone else.
3. Test, Test, Test
- Perform a pilot test of the database. Fill in some records to see if it works the way you expect it to and to assess if it will be useful for the stories you hope to work on. One good way to estimate how long the project might take: Measure and calculate the average time it takes to add a new record, audit, and then confirm the information.
- Make a list of “what ifs” to analyze possible obstacles or error scenarios and establish how you will get around them.
- Evaluate the reliability and consistency of the most important fields. If you have various sources saying different things — which is common with figures or dates — you may want to move the information to a details column where you can describe the disagreement instead of arbitrarily deciding who is telling the truth.
4. Fill in the Database
- Apply what you learn in this testing process to give hands-on training to the reporters who will collect, input, and analyze the information in the database. Make sure everyone understands the concepts and categories the same way.
- Make use of collaborative storage tools, so that access does not depend on only one person.
- Split the data using the categories you defined in the design stage so that the rules are clear about who collects what information and how to avoid duplication.
- If you need to scrape data from the web or from text documents, concentrate your efforts on what is most relevant for your investigation, and what will determine the focus of your stories. In the Troika project, for example, determining the purpose of the transactions was key.
- If the amount of data you have is too big to be manageable, consider hiring an external professional or company to transcribe the documents into a database previously designed with your newsroom.
5. Audit and Fact-Check
- Building the database is only the first step of the investigation. Before analyzing the data and drawing conclusions, you need to confirm it with the original sources, whether that involves documents or the main characters of the stories. “We took our data to the municipalities where massacres occurred so that survivors could correct the mistakes the media and other people had been telling for years,” Parra explains, about one of his projects at Rutas del Conflicto.
- Decide what kind of audit you will do, which will vary depending on the scope of your project. You can check every single record by cross-referencing them with the original documents or you can perform random spot-checks, but they should cover a significant number of records in the database. In either scenario, the person reviewing the data should not be the person who entered it.
- What should you look for in the audit? Typos, numbers, dates, duplicates, and records that do not fulfill the criteria.
- Two ideas for reviewing numbers: make the system automatically sum up totals and compare them to the ones in the original documents, and sort the data to find outliers (figures that are too big or too small and might be a mistake).
- The database will not be ready for use until it has gone through: fact-checking, data auditing, personal source confrontations, and legal review.
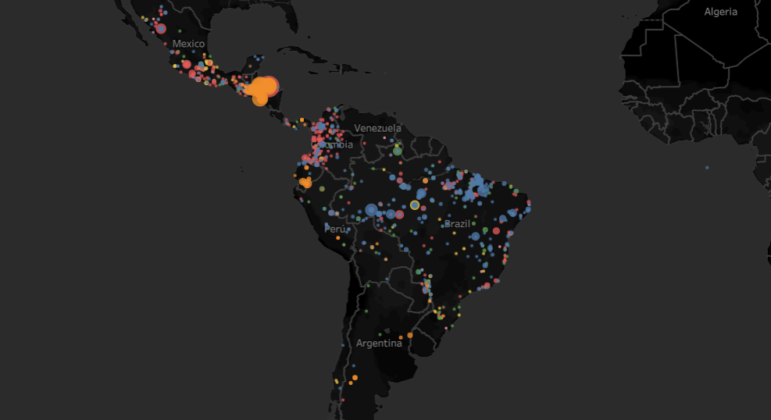
A map detailing attacks on environmental defenders in South and Central America, from the team at Tierra de Resistentes. Image: Screenshot
Software
As a journalist, you don’t need to become a systems developer to work on a database project. Instead, include someone with this expertise on your team and work in partnership. This list of tools may be helpful:
- Apps for creating a web form that will help reporters fill in the database: Google Forms, Node.js, Django, or Flask.
- Database storage: MongoDB Atlas or Google’s Firebase.
- For structuring and processing data: Python (which can be connected to the storage options mentioned above), PostgreSQL, ELK Stack, and Filemaker.
- For data extraction and PDF conversion: Wondershare Pdf Converter Pro, Google Documents basic converter, iLovePDF, Smallpdf, Tabula, Import.io.
- Of course, you can always download the data from the database system and work on it with Excel or Google Spreadsheets. Starting off with one of these can also be the best option for smaller projects.
Final Recommendations and Tips
- Security is a key issue in these types of projects, so use encrypted communications, back-up copies of the data, and consider your personal safety.
- Learn how to use Excel, but also collaborate with data scientists and developers.
- Be aware of instruments that can make the job easier: tools for scraping, online forms to fill the database, PDF converters, scanning with OCR (optical character recognition), and massive text processing. At OCCRP, they created Aleph, a platform that does almost all of these tasks; it helps with easy access, search, transliteration, and browsing of large volumes of multi-format document records.
- Since these initiatives usually require large teams, decide who will be the project leader, and consider recommendations for investigative collaborations.
- Make the methodology and sources transparent for your audience, assuming safety and security protocols allow it. Show a sample of the original documents from which you created the database to build credibility.
- Publish your contact information alongside the investigation so readers can get in touch with questions or if they see a mistake in the database.
Additional Resources
How Journalists Tracked Down Missing Data to Change the Conversation on Homelessness
How To Create a Data Journalism Team
How to Use Data Journalism to Cover War and Conflict
 Miriam Forero Ariza is a Colombian freelance investigative and data journalist whose work has been published by Vice, Colombiacheck, and El Espectador. She has more than a decade of experience in collaborative investigations, data analysis, and visualizations. She is co-author of the Iberoamerican Data Journalism Handbook.
Tipsheet for Using Ocean Data in Your Investigations
What Washington is Doing in Your Country: A Tipsheet for Investigating US Influence Around the World
Free, Game-Changing Data Extraction Tools that Require No Coding Skills
Remote Sensing and Data Tools for Environmental Investigations

This work is licensed under a Creative Commons Attribution-NoDerivatives 4.0 International License
Republish our articles for free, online or in print, under a Creative Commons license.
Republish this article
This work is licensed under a Creative Commons Attribution-NoDerivatives 4.0 International License
Read Next

Data Journalism Reporting Tools & Tips
Spill-Tracking Data Sources to Help Cover Hazmat Events and Environmental Disasters
Environmental journalists should check out the new database tool Spill Tracker, but should also bookmark these other resources for reporting on hazmat events.
Tipsheet Data Journalism Reporting Tools & Tips
Tipsheet for Using Ocean Data in Your Investigations
Investigations into what happens on, under, and around the ocean can often be answered thanks to the vast amount of data available online.

Data Journalism Reporting Tools & Tips
Best Practices for Working With Mass Shootings Data
There can be confusion among journalists about “mass shootings” data, which leads to wildly different numbers and deeper confusion among audiences.

Data Journalism GIJC23 Reporting Tools & Tips
Tips to Guide Investigative Journalists in Document Text Analysis
Investigative journalists often face the challenge of reviewing and combining large documents or data in text forms. This can be very exhausting and labor intensive.