
Data Journalism Top 10: Tulsa Race Massacre, Canada’s Prison Bias, Colombia’s Police Violence, Football’s Big Money, Europe’s Lobbyists, Battling Misinformation
Read this article in
For inmates in Canada, risk assessments can determine which type of prison they are sent to and their chances of successfully reentering society. But an investigation by The Globe and Mail revealed that these assessments are biased against Indigenous and Black inmates. Our NodeXL #ddj mapping from May 24 to 30, which tracks the week’s most popular data journalism stories on Twitter, also found an interactive project by The New York Times recreating the Black neighborhood in Tulsa, Oklahoma, which was destroyed in 1921. We also feature more data journalism on the influence of big money in football (that’s soccer for you Yanks), the cost of Italy’s vaccination campaign, and police violence during recent protests in Colombia.
Tulsa Race Massacre
In 1921, a prosperous Black neighborhood in Tulsa, Oklahoma, was attacked and destroyed by a violent white mob. Hundreds of residents were killed in the massacre while more than 1,250 homes were burned. A century later, The New York Times dived into an archive of maps, photographs, newspapers, and other data sources to recreate the neighborhood of Greenwood, a once-thriving area where lives, businesses, and dreams were destroyed.
How Big Money Remade Football (Soccer)
Back in the 19th century, football offered a source of entertainment for working class supporters in England and other European nations. As the sport spread around the globe in the following decades, it maintained its reputation as “the people’s game.” But massive investments have dramatically altered the sport. An in-depth project by Reuters analyzes data on wages, club costs, stadium ownership, and attendance revenue to explain how big money has transformed football forever.
Bias Behind Bars
Risk assessments play a major role in determining where an inmate is incarcerated, what rehabilitation programs they are offered, and the odds of successfully reentering society. An investigation by Canada’s The Globe and Mail using data by the Correctional Service of Canada found that this system is biased against Indigenous and Black prisoners, with Black men nearly 24% more likely than white men to receive a “maximum” initial security rating, the worst possible score.
Meetings with Lobbyists
Meetings between politicians and interest groups are commonplace in the European Union, but lax regulations relating to lobbying disclosure at the European Parliament means representatives do not have to be fully transparent about their ties to these groups. An investigation by Spain-based Civio Foundation found that half of all parliamentary representatives — or MEPs — have never reported meeting with any lobbyists. While Civio’s reporters accept that some politicians may not have had contact with lobbyists, they find the reported numbers “highly unlikely.”
The Cost of Italy’s Vaccination Campaign
As with many other countries in Europe, Italy’s coronavirus vaccination campaign is surging ahead, with hundreds of thousands of people receiving a dose each day. But the immunization campaign comes at considerable cost. Data analysis by Italy’s online daily Il Post reveals an allocation of 1.42 billion euros ($1.7 billion) to organize the campaign, purchase and transport vaccine doses, and prepare vaccination points across the country.
How to Fix America
From energy efficiency to public schools, to transportation hubs and airports, various aspects of the infrastructure of cities across the United States need to be improved in order to make them more livable and equitable. Bloomberg’s CityLab team examined ambitious US infrastructure projects from coast to coast to examine how they could transform the lives of local communities.
Britain’s Third Wave?
The spread of the coronavirus variant B.1.617.2 in the UK is fueling a third wave, with regions across the country reporting rising cases and hospital admissions. The Financial Times’ John Burn-Murdoch notes that vaccines will make this wave different from previous ones. In a thread on Twitter, Burn-Murdoch summarized what we know about the outbreak so far, and warns that the challenges linked to the variant are ones that “other countries will soon face.”
Battling Misinformation
Where do you get your news about the pandemic? According to a report by the Reuters Institute for the Study of Journalism, news organizations are the single most widely used source of information about the virus for people in eight countries (Argentina, Brazil, Germany, Japan, South Korea, Spain, the UK, and the US). More importantly, the study found that relying on news organizations for their information “is significantly associated with lower belief in vaccine misinformation.”
Mapping Police Violence in Colombia
In Colombia, the media outlet Cerosetenta teamed up with Bellingcat and Forensic Architecture to map police violence during recent protests. Demonstrations began on April 28 against a tax reform proposed by the government of Iván Duque. In a piece for the Knight Center’s Latin American Journalism Review, also published by GIJN, Brazilian journalist Marina Estarque offers an insight into this data journalism project.
Working in Data Journalism
Looking to build a career in data journalism? Now might be a great time to do it, says the European Data Journalism Network (EDJNet), a leading platform for data-infused news on European affairs. In an interview with Deutsche Welle Innovation, EDJNet coordinators Chiara Sighele and Lorenzo Ferrari talk about the advantages and challenges of data journalism and how it intersects with technology like drones, satellites, sensors, and AI.
Thanks again to Marc Smith and Harald Meier of Connected Action for gathering the links and graphing them. The Top Ten #ddj list is curated weekly.
 Peter Georgiev is GIJN’s social media and engagement editor. Previously, he was part of NBC News’ investigative unit in New York. He also worked as a correspondent for Bulgarian National Television and his reporting has been published by the Guardian, Deutsche Welle, and other international outlets.
For a look at NodeXL’s mapping on #ddj and data journalism on Twitter, check out this map.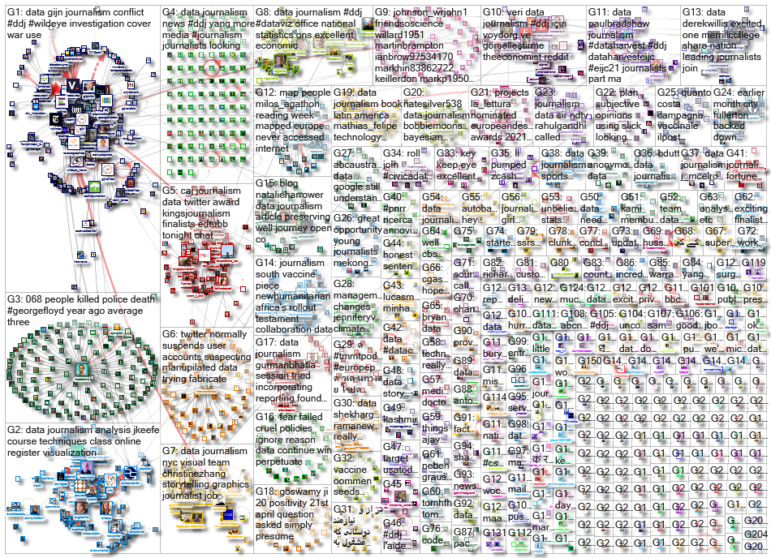

Reporter’s Guide to Investigating Cryptocurrency

Tipsheet on Partnering with Civil Society Organizations and Non-Governmental Organizations

AI Accountability Reporting Guide

Guide to Mapping Analysis Using QGIS

Data Journalism Top 10: How COVID-19 Changed the US, Race for the North Pole, and Visualizing Coronation in the UK
Data Journalism Top 10: Migrant Deaths, Alps Skiing, Ukraine’s Outages, Deadly Deer
Data Journalism Top 10: Kids’ Fashion Stereotypes, Economic Sandwich Index, Immigration Profits, and Florence Nightingale’s Graphics
Data Journalism Top 10: Sweltering Cities, Digital Inequity, Climate & Sleep, COVID & Schools

This work is licensed under a Creative Commons Attribution-NoDerivatives 4.0 International License
Republish our articles for free, online or in print, under a Creative Commons license.
Republish this article
This work is licensed under a Creative Commons Attribution-NoDerivatives 4.0 International License
Read Next
Data Journalism Data Journalism Top 10
Data Journalism Top 10: How COVID-19 Changed the US, Race for the North Pole, and Visualizing Coronation in the UK
This week GIJN’s Top 10 in Data Journalism features the Wall Street Journal’s dive into how COVID-19 changed the daily lives of Americans, the Straits Times on Singapore’s gold medal history at the Southeast Asian Games, and how data journalists visualized the coronation of King Charles III.
Data Journalism Data Journalism Top 10
Data Journalism Top 10: Migrant Deaths, Alps Skiing, Ukraine’s Outages, Deadly Deer
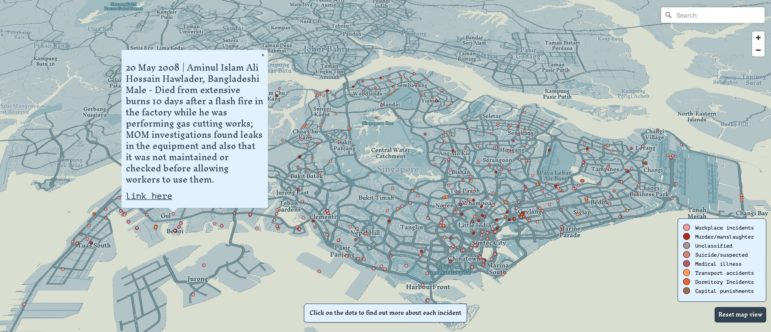
Our weekly NodeXL and human curation of the most popular data journalism stories looks at mapping migrant deaths in Singapore, tracking Russian airstrikes and Ukraine power outages, “authorized deforestation” in Mali and Côte D’Ivoire, and analysis of the best value when skiing in Switzerland.
Data Journalism
Data Journalism Top 10: Kids’ Fashion Stereotypes, Economic Sandwich Index, Immigration Profits, and Florence Nightingale’s Graphics
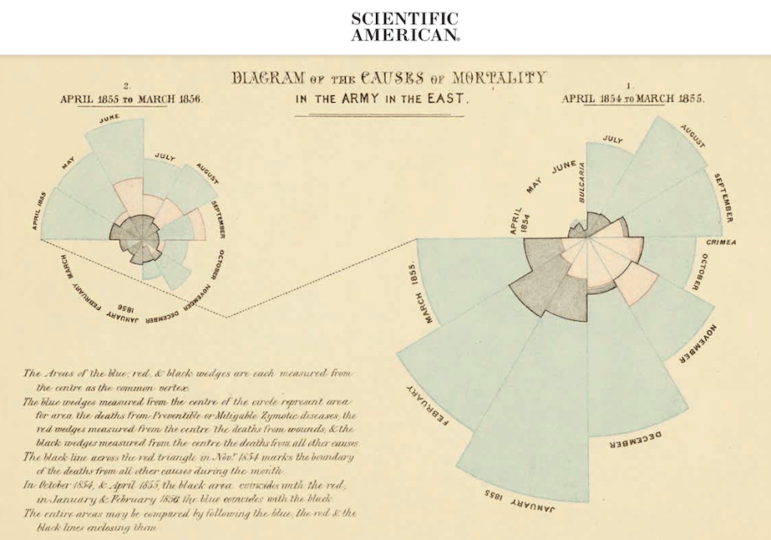
Children’s fashion is riddled with gender stereotypes, according to an analysis by German newspaper Süddeutsche Zeitung, which found that popular children’s clothing tended to be more revealing for girls, but comfortable and functional for boys. Also this week, analysis of the big earners in the healthcare industry, the tracking of post-pandemic recovery through sandwich sales, and Florence Nightingale’s contribution to graphic storytelling.
Data Journalism
Data Journalism Top 10: Sweltering Cities, Digital Inequity, Climate & Sleep, COVID & Schools
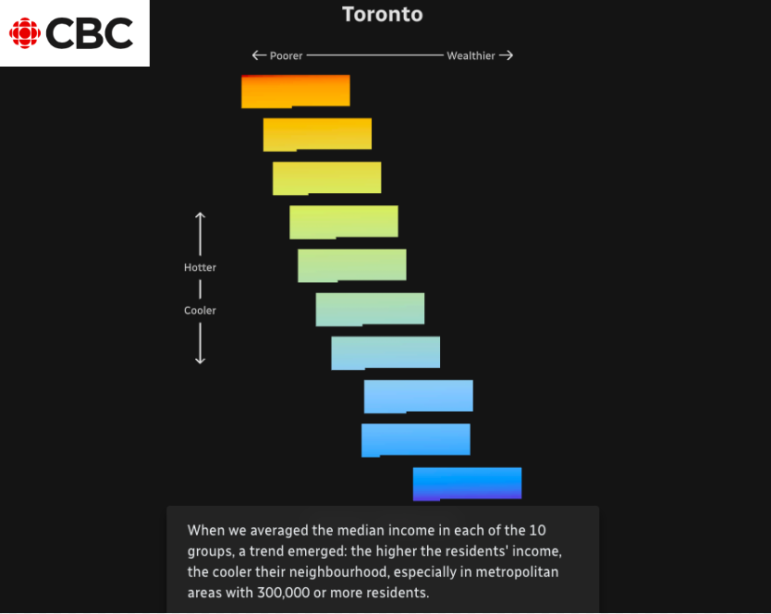
As parts of the world endure record-breaking temperatures, a highlight from the world of data journalism this week involves an analysis of how “heat islands” in Canadian cities vary based on economic strata. Our weekly Top Ten in Data Journalism also looks at the global spread of Pegasus spyware, digital inequity in the US, and how the COVID-19 pandemic affects school children in Latin America.