Data Journalism Top 10: Mission to Mars, Myanmar’s Protesters, Sand Mining, Journalism in Russia
Read this article in


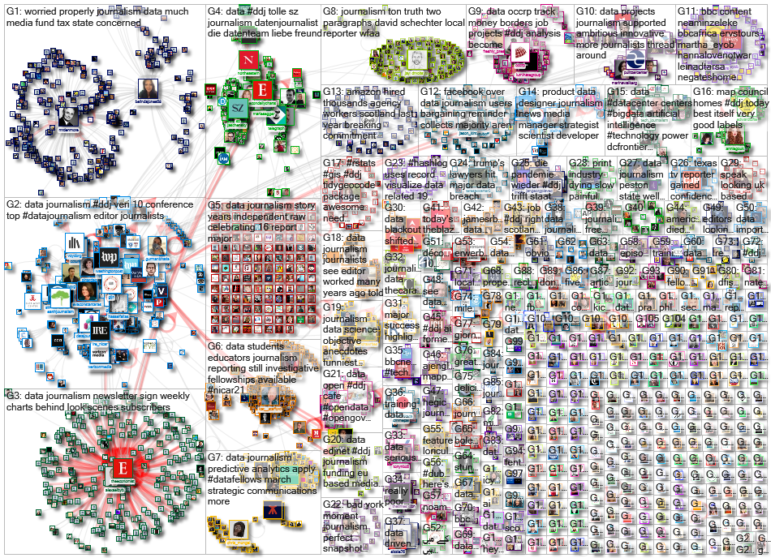
Sometimes, when the world is in crisis, it can help to look up to the skies, and some positive news came from a different planet last week. After going through “seven minutes of terror,” NASA’s Perseverance rover managed to successfully touch down on Mars. Our NodeXL #ddj mapping from February 15 to 21 found reporting by The Wall Street Journal and Al Jazeera offering insight into the rover’s journey to the red planet and the challenges of its landing. In this edition, we also feature a New York Times story about the boom in independent journalism in Russia, a look at South Africa’s coal mining industry by GIJN member Oxpeckers, and the limitations of data visualization in conveying the realities of large-scale tragedies.
Landing on Mars
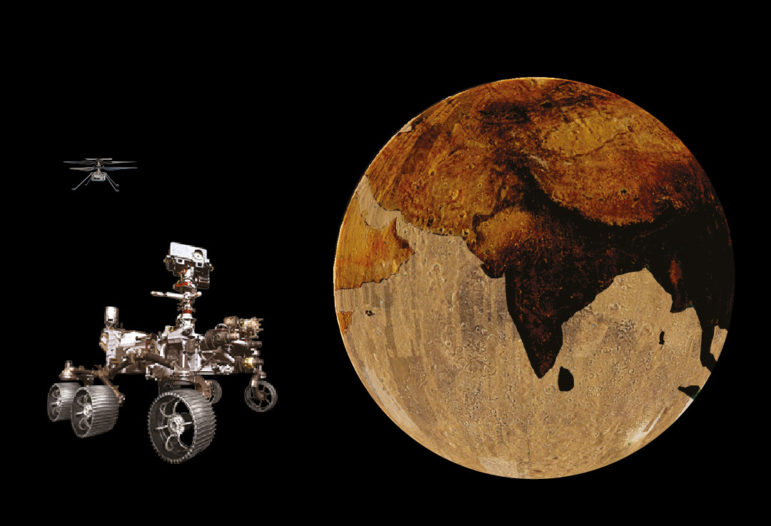
In its most ambitious attempt yet to find evidence of past life in another world, NASA landed the Perseverance rover on Mars. The car-sized “robotic astrobiologist” will spend the next two years exploring the red planet. Through a series of infographics and visuals, The Wall Street Journal illustrated the stages of the rover’s complicated landing procedure and compared Perseverance to the other robots and rovers that have landed on Mars.
Understanding the Red Planet
Since 1960, Earth has sent 49 missions to Mars, with almost half of the attempts by the United States. Have you ever wondered how far away the planet is from us, or whether you would survive on its surface? Al Jazeera produced seven infographics to help readers learn more about Mars and compare it to our home world.
Fire Maps
In recent years, large fires have caused devastating damage in Australia, California, and other regions across the globe. This visual story from the Guardian, built around several maps, shows how the fires have spread to previously untouched ecosystems. The maps are based on burned-area data from the Global Fire Emissions Database and NASA.
Covering Climate Change
Climate change is now a central topic for international news outlets, who often assign experienced journalists to report on the global impact of extreme weather. But for local reporters, especially in communities where climate change skepticism runs high, this kind of coverage can be a challenge. In Texas, a TV reporter who had previously been intimidated by the subject finally gained confidence after exploring high-quality research and data.
Investigative Reporting in Russia
Western media outlets tend to be skeptical of news organizations which use unorthodox methods to gather and report information. In Russia, however, the practice of buying call records, cellphone geolocation information, and other data on the internet — a technique called probiv — has enabled a number of investigative outlets to lift the veil on President Vladimir Putin’s secrets. The New York Times gives examples of how this approach, used by “a new wave” of outlets, has led to crucial revelations. (Don’t miss GIJN’s own stories on the Navalny I-team and best investigations in Russian.)
Silencing Myanmar’s Protesters
The military coup in Myanmar on February 1, which overthrew Aung San Suu Kyi’s elected government, prompted hundreds of thousands of protesters to take to the streets. The youth-led opposition to the coup has been powered by digital technology and social media. But this in-depth story by Rest of World highlights how the junta has taken drastic measures to silence young Burmese protesters.
The Future of South African Coal
With a number of major companies pulling out of coal mining in South Africa, the future of the country’s once-thriving coal industry remains uncertain. The Oxpeckers Center, a nonprofit newsroom, found that, despite the country’s move toward renewable sources, there are more than a hundred new coal projects currently in progress. In this data visualization, the outlet examined to what extent coal will remain a part of South Africa’s energy mix.
Sand Mining
When it comes to construction, the sand from global deserts is useless, so to build our cities we have to mine specific types of sand. The pace of urbanization has rapidly increased the demand for this material in the last two decades, especially in China, India, and other fast-developing countries. This deep dive by Reuters, filled with eye-catching visuals, explains how unregulated sand mining causes serious environmental damage and jeopardizes livelihoods.
Turning People into Dots
Shortly before the COVID-19 death toll in the US passed 500,000, The New York Times published a memorable graphic on its front page depicting each fatality as an individual dot. The graphic — intended to display a “wall of grief” — sparked a discussion among data journalism experts. In a Twitter thread, and related blog post, Francis Gagnon, founder of information design company Voilà, argued that The Times’ front page demonstrates that data visualizations fail to adequately express the devastation caused by the pandemic.
Supporting Data Journalism
Are you thinking about your next data journalism project? If you need some inspiration, the Pulitzer Center highlighted examples of journalists who have used data to tell stories in an innovative way, including the “Land Grab” database of 11 million acres of land taken from Indigenous people and granted to universities in the US. The organization wants to support more of these projects, so feel free to pitch them your ideas.
Thanks again to Marc Smith and Harald Meier of Connected Action for gathering the links and graphing them. The Top Ten #ddj list is curated weekly.
 Peter Georgiev is GIJN’s social media and engagement editor. Previously, he was part of NBC News’ investigative unit in New York. He also worked as a correspondent for Bulgarian National Television and his reporting has been published by the Guardian, Deutsche Welle, and other international outlets.
For a look at NodeXL’s mapping on #ddj and data journalism on Twitter, check out this map.

This work is licensed under a Creative Commons Attribution-NoDerivatives 4.0 International License
Republish our articles for free, online or in print, under a Creative Commons license.
Republish this article
This work is licensed under a Creative Commons Attribution-NoDerivatives 4.0 International License
Read Next

Data Journalism News & Analysis
From Space to Story in Data Journalism
Over the past 10 years satellite imagery has become an important component of data journalism. In the next 10, it will likely evolve further, from a tool used primarily for illustrating stories to an integral part of research and investigative reporting.

Data Journalism
10 Outstanding Data Projects Win the 2024 Sigma Awards
There were 52 data journalism entries from 22 countries in shortlist for the 2024 Sigma Awards. Here are the top 10 winning projects.

Tipsheet Data Journalism Reporting Tools & Tips
Tipsheet for Using Ocean Data in Your Investigations
Investigations into what happens on, under, and around the ocean can often be answered thanks to the vast amount of data available online.

Data Journalism Reporting Tools & Tips
Best Practices for Working With Mass Shootings Data
There can be confusion among journalists about “mass shootings” data, which leads to wildly different numbers and deeper confusion among audiences.