
Image: Screenshot, Copernicus Browser
Turning Copernicus Satellite Data Into Public-Interest Climate Stories

Step-By-Step Guide for Journalists on the Basics of Google Sheets

Tipsheet for Using Ocean Data in Your Investigations
No Coding Required: A Step-by-Step Guide to Scraping Websites With Data Miner

GIJC23 – The Future of Data Journalism: New Analytical Tools, Data Visualization, and AI
Climate change is often reported through global records and international headlines. Yet its effects are experienced locally. Farmers adapt to changing seasons, coastal communities face warmer seas, and cities struggle with longer and more intense heatwaves. These local changes create important public interest stories, but many journalists avoid climate data because it seems too technical or difficult to understand.
I faced the same challenge while reporting on climate change in Turkey’s Aegean region. The Copernicus Browser and Sentinel satellite imagery offer one of the world’s largest collections of free climate data, but finding information is only the first step. The real challenge is turning scientific observations into stories that readers can understand and relate to.
One piece of advice from Copernicus Climate Change Service (C3S) climate scientist Francesca Guglielmo shaped the way I approached this project. Rather than focusing on individual temperature records, she said she encourages journalists to explain how different climate indicators work together and how those changes affect people’s lives.
This tipsheet follows that advice. Instead of explaining climate science in technical language, it offers a practical workflow that journalists can use to discover story ideas, verify climate data and connect satellite observations with local reporting.
Where to Begin
The Copernicus Climate Data Store can appear intimidating at first. Thousands of datasets, unfamiliar file formats, and scientific terminology often discourage reporters before they even begin. Fortunately, most journalists do not need advanced technical skills or programming experience to produce strong climate stories.
A good starting point is to use the browser-based tools created specifically for non-technical users.
The Press Data Portal allows journalists to search by country, region, and time period while automatically generating charts that can quickly reveal long-term climate trends.
Climate Pulse helps reporters place recent weather events into historical context. During a heatwave, flood or drought, it allows you to compare current conditions with previous years within minutes.
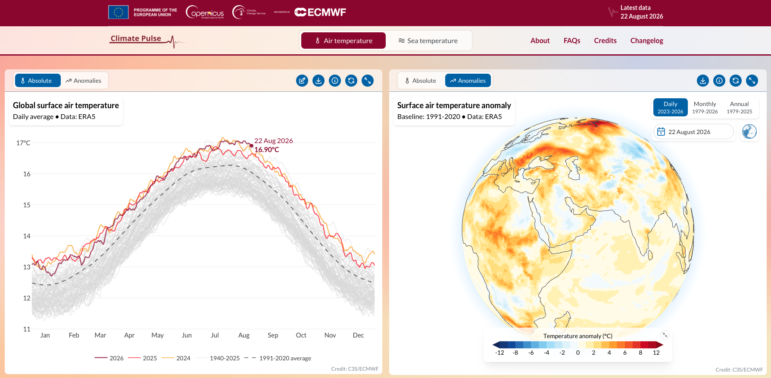
The Climate Pulse website on the Copernicus Browser offers real-time snapshots of temperature anomalies. Image: Screenshot, Copernicus Browser
Three types of information are especially useful for local reporting.
- Temperature anomalies, which help determine whether recent weather is unusual compared with historical averages.
- Land monitoring data, which reveals changes in forests, agriculture, vegetation, and urban expansion.
- Atmospheric data, which provides information about air quality, greenhouse gases, wildfire smoke, and other environmental conditions that affect public health.
Before using any dataset, always identify the reference period. A statement such as “1.7°C warmer” has little meaning unless readers know which historical period is being used for comparison.
Instead of treating Copernicus as a database full of numbers, think of it as a tool for finding reporting questions. The purpose of climate data is not simply to confirm that temperatures are rising. Its real value is helping journalists identify stories that deserve further investigation.
Simple Workflow for Climate Reporting
Finding an interesting graph is not the same as finding a story. Climate data should be the starting point of your reporting, not the final product. The strongest investigations combine satellite observations with reporting, interviews, and scientific expertise.
Step 1: Look for trends, not single events
Begin with the Press Data Portal or Climate Pulse and search for patterns over time. Compare several years instead of focusing on one unusually hot day or one heavy rainfall event.
Ask simple reporting questions.
- Is my region warming faster than it did 10 years ago?
- Have droughts become more frequent?
- Are heatwaves lasting longer?
- Is rainfall becoming less predictable?
These questions help identify stories worth investigating.
Step 2: Compare more than one climate indicator
Climate change rarely affects only one variable. A temperature rise may also influence soil moisture, water availability, vegetation, or sea surface temperatures.
Instead of analyzing a single dataset, compare different indicators. Looking at several variables together often reveals a clearer story and helps explain why environmental changes are happening.
Step 3: Make the story local
Readers connect with places they know.
Rather than writing about climate change across an entire country, focus on one community, one coastline, or one agricultural region.
For example, instead of the query: “Is the Mediterranean getting warmer?”, ask: “How are rising sea temperatures affecting fisheries along Turkey’s Aegean coast?”
The narrower the question, the stronger the reporting usually becomes.
Step 4: Verify the data through reporting
Satellite observations should always be tested against what is happening on the ground.
Visit the affected area whenever possible. Speak with farmers, fishermen, local officials, residents, and environmental organizations. Their experiences help explain what the data actually means in everyday life.
Good reporting does not replace scientific evidence. It gives that evidence context.
Step 5: Ask experts to explain the findings
Climate data should not be interpreted without scientific support.
Researchers can explain whether a trend reflects long term climate change, natural variability, or another environmental process. They can also identify the limitations of a dataset and help avoid misleading conclusions.
Expert interviews strengthen both the accuracy and credibility of your climate reporting.
Step 6: A final check before publishing
Before your story goes online, ask yourself five questions.
- Have I explained what the data measures?
- Have I identified the reference period?
- Have I verified the findings through reporting?
- Have I included expert interpretation?
- Have I explained why local readers should care?
If the answer is yes to all five questions, you have done more than report climate statistics. You have produced a story that combines evidence, reporting, and public interest.
Ground Truthing: Confirm the Story on the Ground
Climate data can show where change is happening, but it cannot explain how people experience it. That is where reporting begins.
Every climate investigation should combine three sources of evidence: satellite observations, field reporting, and expert analysis.
Start by speaking with the people who are directly affected. Farmers, fishermen, foresters, and local residents often notice gradual environmental changes long before they appear in official reports.
While reporting in Bergama, a district in Izmir Province in western Turkey near the Aegean coast, I interviewed olive growers about changing weather patterns. One farmer told me: “We hardly have a real spring anymore. Winter ends and the summer heat arrives almost immediately. We begin irrigating much earlier than we did years ago.” His experience reflected what the Copernicus data showed. Rising temperatures were changing seasonal patterns and increasing pressure on local water resources. My interview did not replace the data. It explained what the numbers looked like in everyday life.
The next step is to consult scientists.
For this project, I also spoke with marine researchers studying the eastern Mediterranean. They explained how rising sea temperatures are affecting marine ecosystems, including Posidonia oceanica seagrass meadows that support biodiversity and coastal fisheries.
Without those interviews, the reporting would simply have shown that sea temperatures were increasing. The experts explained why those changes matter.
When satellite observations, local reporting, and scientific expertise support the same conclusion, climate stories become both stronger and more credible.
Case Studies: Learning from Other Newsrooms
Many news organizations already use Copernicus data successfully. Their reporting offers practical ideas that local journalists can adapt.
To examine how climate change is affecting daily life in Italy, the newsroom combined ERA5 land data with humidity and public health indicators to create an interactive climate liveability index earlier this summer
Instead of focusing on record temperatures, the project helped readers understand how changing climate conditions affect the places where they live.
Lesson: Connect climate data to everyday life.
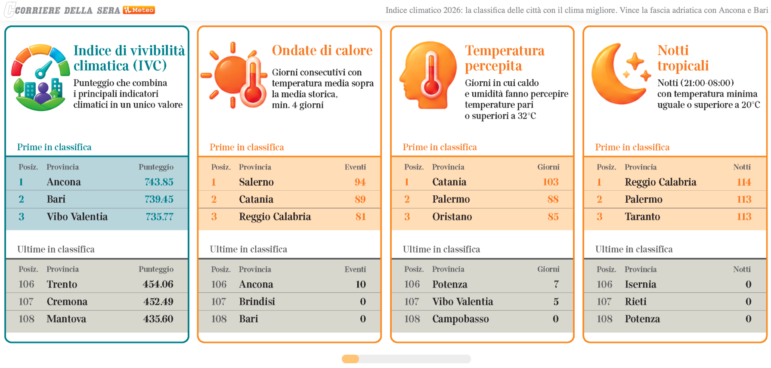
The Italian news site Corriere della sera created an interactive climate livability index for cities all across the country, based on Copernicus satellite data. Image: Screenshot, Corriere della sera
Rather than relying on national averages, Il Post analyzed temperature changes at the municipal level based on Copernicus data.
Its interactive reporting feature, which allowed readers to plug in their own hometown, showed that climate change does not affect every community in the same way. Local differences became the story.
Lesson: Local data often reveals stories that national statistics hide.
The Financial Times investigated rising nighttime temperatures across Europe.
Instead of asking how hot days had become, the newsroom investigated how warmer nights affect public health, sleep quality, and cities’ ability to recover from heatwaves.
The investigation demonstrated that choosing a different reporting angle can produce a stronger story than simply reporting another temperature record.
Lesson: Ask a better question, not just for bigger numbers.
Although these investigations covered different topics, they followed the same reporting process. They started with reliable climate data from Copernicus, verified it through additional reporting, and explained why the findings mattered to people’s audiences. The same approach can be applied to local journalism anywhere.
Communicating Climate Stories Effectively
Climate journalism is most effective when it helps readers understand how environmental change affects their daily lives. Numbers alone rarely achieve that. The challenge is not finding more data, but explaining why the data matters.
A rise in temperature becomes meaningful when it is linked to its consequences. Does it increase irrigation needs? Does it shorten growing seasons? Does it affect fisheries, biodiversity, or public health? These are the questions that transform scientific information into public interest reporting.
During my conversations with Copernicus scientists, one recommendation stayed with me. Journalists should avoid treating climate records as isolated events. Instead, they should explain how different climate indicators are linked and how those connections influence communities.
Visual storytelling is equally important. Maps, charts, and interactive graphics help readers understand complex information more quickly, especially when they are supported by interviews, photographs, and reporting from the field.
Climate reporting should inform rather than overwhelm. The goal is not to produce the most alarming headline, but to give readers reliable information, clear context, and evidence they can trust.
Conclusion
Copernicus provides journalists with free access to one of the world’s richest collections of climate information. For local reporters, it offers opportunities to investigate issues ranging from agriculture and water resources to public health, biodiversity, and urban planning.
Data alone, however, is never enough.
The strongest stories begin with satellite observations and scientific data, continue with reporting in affected communities, and are strengthened by scientific expertise. Together, these elements produce journalism that is accurate, accessible, and relevant.
It helps journalists ask better questions, verify their findings, and tell stories that matter to the communities they serve.
 Alev Celep is a freelance journalist and a senior journalism student at Ege University in İzmir, Turkey. She focuses on solutions journalism, climate reporting, and environmental accountability across the Aegean and Mediterranean regions.
Step-By-Step Guide for Journalists on the Basics of Google Sheets
Tipsheet for Using Ocean Data in Your Investigations
No Coding Required: A Step-by-Step Guide to Scraping Websites With Data Miner
GIJC23 – The Future of Data Journalism: New Analytical Tools, Data Visualization, and AI
How a WhatsApp Community Is Bringing India’s Data Storytellers Together
Turning the Threat to a Distant Glacier into a Local Story Through Data Visualization
One Name at a Time: How Die Zeit Built a Searchable Database of Nazi Party Members

Making Trillions Make Sense: How Reuters Visualized the AI Economy

This work is licensed under a Creative Commons Attribution-NoDerivatives 4.0 International License
Republish our articles for free, online or in print, under a Creative Commons license.
Republish this article
This work is licensed under a Creative Commons Attribution-NoDerivatives 4.0 International License
Read Next
Data Journalism
How a WhatsApp Community Is Bringing India’s Data Storytellers Together
Recently, more than 400 people gathered in the Indian city of Bengaluru for VizChitra 2026, a conference on data visualization and storytelling — but that is only a small part of the story.
Climate Data Journalism
Turning the Threat to a Distant Glacier into a Local Story Through Data Visualization
New York Times climate and environmental graphics reporter Mira Rojanasakul discusses how her team visualized the sea level rise threat from the melting Thwaites Glacier in Antarctica.
Data Journalism
One Name at a Time: How Die Zeit Built a Searchable Database of Nazi Party Members
An online tool set up by the German newspaper Die Zeit, in cooperation with archives in Germany and in the United States, allows people to search several million Nazi Party membership cards.
Data Journalism
Making Trillions Make Sense: How Reuters Visualized the AI Economy
How do you make a trillion dollars feel real to someone who has never seen that much money? Vineet Khare and Mayank Bhatt faced that very challenge for their data-driven investigation into AI investment.