Data Journalism Top 10: Black Lives Matter, Racial Wealth Gap, Pandemic Lockdown Violations, Housework Gender Inequality
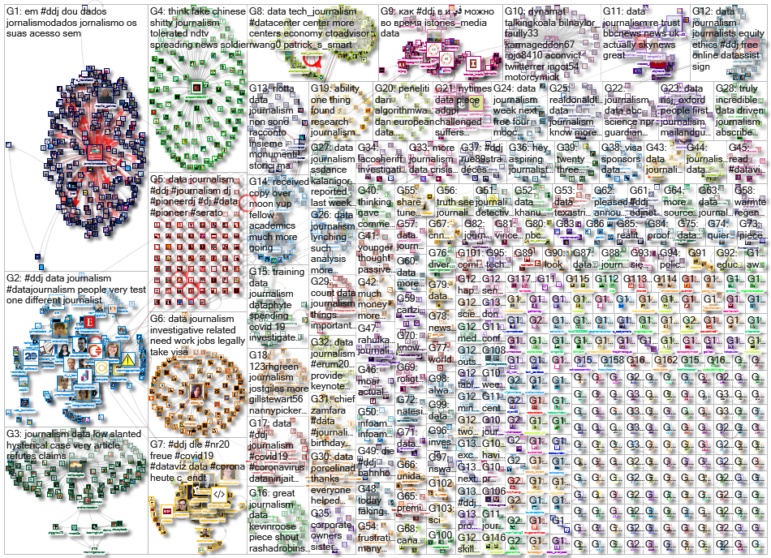
Once confined to bands of protesters, the Black Lives Matter movement has spread across America. Our NodeXL #ddj mapping from June 15 to 21 finds The New York Times mapping the protests in more than 2,000 US cities and towns over a two week period. On the coronavirus front, The Telegraph analyzed the widening racial wealth gap caused by the pandemic, the Guardian and Liberty Investigates looked into police enforcing lockdown measures disproportionately against Blacks, Asians, and other minorities, while Important Stories and Holod Media examined the fines issued by Russian courts for lockdown violations during the pandemic.
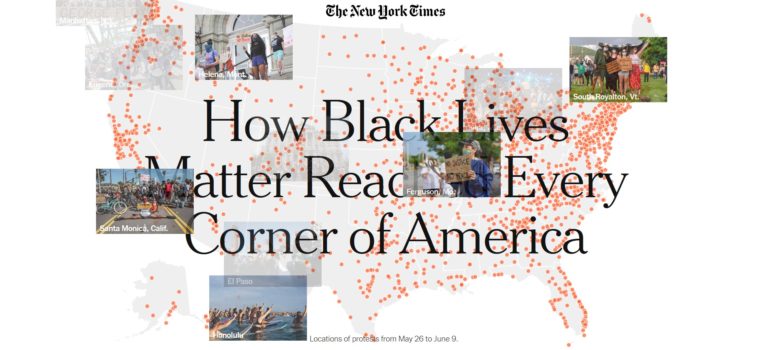
BLM Protests across America
Will the rage against racism and cries for structural reforms bring change in the treatment of African Americans in the United States? The New York Times mapped Black Lives Matter protests across the country between May 26 and June 9, a period which saw hundreds of thousands of people in more than 2,000 cities and towns march on the streets. The locations were compiled from local news reports and from lists created by the Count Love protest figures website and data analyst Alex Smith.
UK: COVID-19 Racial Wealth Gap
Due to the coronavirus lockdown, Britain’s racial wealth gap is widening. The Black, Asian, and minority ethnic (BAME) communities have been more likely to lose their jobs than be furloughed during the lockdown. BAME households are also falling behind on bills, and are nearly two times more likely to have borrowed money or applied for government assistance compared to non-BAME households. There’s a summary of the story in this tweet thread.
Police Bias in England and Wales
According to figures obtained by the UK-based civil liberties group Liberty Investigates, police enforcing the coronavirus lockdown in England and Wales were almost up to seven times more likely to issue fines to Black, Asian and minority ethnic people than white people. Bias, lack of trust from certain communities, and demographics could be contributing factors.
Russia: Pandemic Crimes and the Courts
Important Stories and Holod Media analyzed all publicly available case decisions made by Russian courts related to the pandemic in April and May. They found that the courts had already imposed at least 407.6 million rubles ($5.8 million) in fines for violating self-isolation rules, and almost a million rubles in penalties for disseminating fake COVID-19 news. The journalists also discovered that judges were abnormally productive during the pandemic; some of them managed to review several hundred cases in one working day, while the most productive judge was apparently making court decisions every 16 seconds some days. (In Russian.)
Visualizing Coronavirus with Live Updates
Back in March, Berlin-based designer and blogger Lisa Charlotte Rost created a list of visualizations about the coronavirus pandemic that are regularly updated with data from John Hopkins University. The visualizations display confirmed COVID-19 cases, deaths and recoveries by country, weekly mortality rates, and more. All the charts, maps, and tables are made with Datawrapper and you are free to use, adapt, and embed the visualizations for your own use.
Housework Gender Inequality
Are women being relegated to traditional female roles during the pandemic? Researchers in Germany surveyed more than 10,000 people about the division of labor in families to find out. But comparing the data to last year, results show that couples are now sharing household chores more equally even though women are still carrying the main burden of unpaid care work. (In German.)
The Pandemic’s True Death Toll
Much has been written about the COVID-19 “excess deaths” figure, which is the number of deaths above the average in a non-pandemic year. The BBC reports that at least another 130,000 people worldwide have died during the pandemic on top of 440,000 officially recorded deaths from the virus. Explore the BBC’s animated guide and analysis of excess deaths in 27 locations including Japan, Peru, and Serbia.
Gun Permits for Political Cash?
Officials in California’s Santa Clara County are investigating whether Sheriff Laurie Smith gave out concealed weapon permits in exchange for political campaign money. NBC’s Bay Area Investigative Unit looked at the data and found that the Sheriff’s office was roughly 14 times more likely to grant permits to her campaign donors than to applicants who didn’t contribute.
Who Will Win the US Presidency?
The Economist is combining and analyzing election polls with economic and demographic data to forecast the 2020 election results in the US. Explore Democratic candidate Joe Biden’s and incumbent US President Donald Trump’s chances of winning in three interactive visualizations.
DDJ Community to the Rescue
Disha Raychaudhuri, a data and investigations reporter formerly at NJ Advance Media, posted an urgent job plea on Twitter. The massive response from the data journalism community on the platform — with more than 4,000 retweets, plenty of links to job vacancies, and tagging of key data team leads — is simply heartwarming. Read the full thread here.
Thanks again to Marc Smith of Connected Action for gathering the links and graphing them. The Top Ten #ddj list is curated weekly.
 Eunice Au is GIJN’s program coordinator. Previously, she was a Malaysia correspondent for Singapore’s The Straits Times, and a journalist at the New Straits Times. She has also written for The Sun, Malaysian Today, and Madam Chair.
For a look at NodeXL’s mapping on #ddj and data journalism on Twitter, check out this map.

Tipsheet on Partnering with Civil Society Organizations and Non-Governmental Organizations

AI Accountability Reporting Guide

Guide to Mapping Analysis Using QGIS

Open Source Databases by Country

How Data Journalism Is Changing the Face of Africa
Airplane Accidents, 2024 Elections, Europe’s Lost Snowfall, and Recycling Movies

Data-Driven Journalism: Roundup of Recent Standout Stories
Data Journalism Top 10: Everest’s Deadly Legacy, Paris Metro Pollution, Migrant Worker Struggles in Singapore

This work is licensed under a Creative Commons Attribution-NoDerivatives 4.0 International License
Republish our articles for free, online or in print, under a Creative Commons license.
Republish this article
This work is licensed under a Creative Commons Attribution-NoDerivatives 4.0 International License
Read Next
Africa Focus Data Journalism
How Data Journalism Is Changing the Face of Africa
Data journalism in Africa has made a powerful impact, from holding leaders accountable to refuting myths around domestic violence. But the field faces formidable challenges.
Data Journalism Data Journalism Top 10
Airplane Accidents, 2024 Elections, Europe’s Lost Snowfall, and Recycling Movies
With pieces on the global campaign landscape, airplane accidents, European snowfall, and the toll of the ongoing Israel-Hamas conflict in Gaza.
Case Studies Data Journalism GIJC23
Data-Driven Journalism: Roundup of Recent Standout Stories
The best of modern data journalism tells powerful stories that test assumptions. At GIJC23, two experts discussed strong recent investigations and what makes them stand out.
Data Journalism Data Journalism Top 10
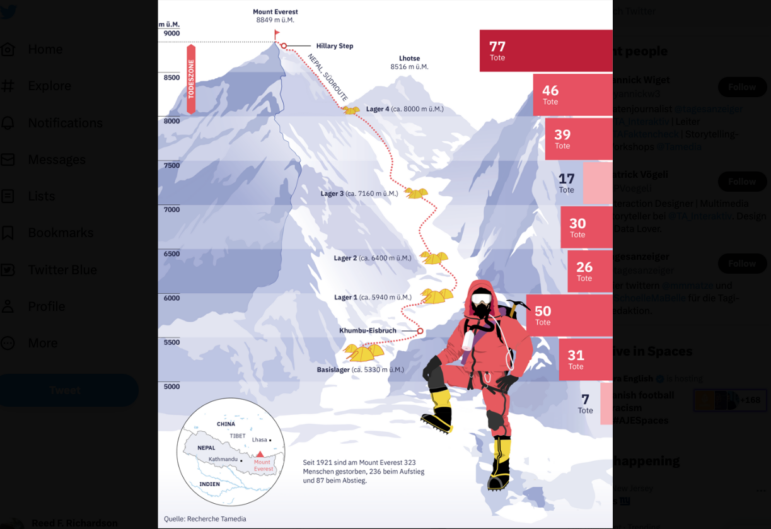
Data Journalism Top 10: Everest’s Deadly Legacy, Paris Metro Pollution, Migrant Worker Struggles in Singapore
This week, GIJN’s Top 10 in Data Journalism examines why the world’s tallest mountain has become increasingly deadly for those trying to climb it, pollution in Paris metro stations, US laws expanding gun access one year after the Uvalde mass shooting, and migrant worker struggles in Singapore.