
GIJN’s Data Journalism Top 10: Populism Popularity, DataViz Pedagogy, National vs. Local Media, German Migration
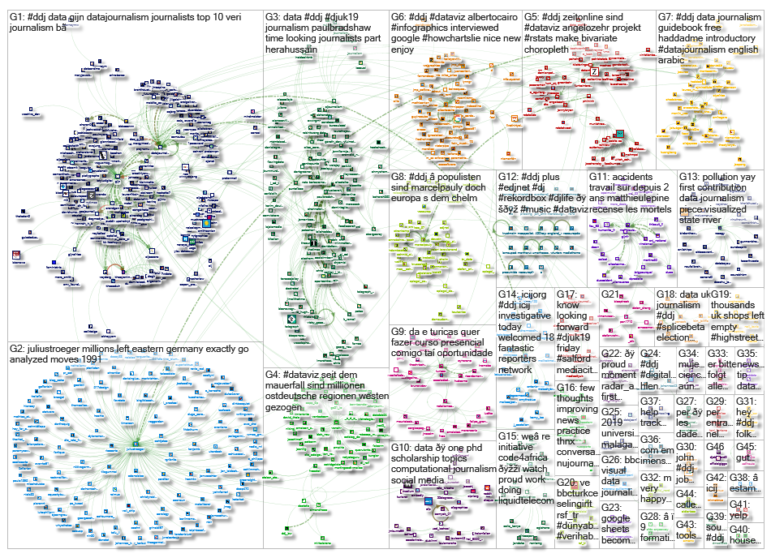
What’s the global data journalism community tweeting about this week? Our NodeXL #ddj mapping from April 29 to May 5 finds @zeitonline mapping German migration post-reunification, @FILWD pointing out the gaps in current data visualization teaching syllabi, @AlJazeera launching its data journalism introductory guide, and @WSJ highlighting the stark divide between national and local media in the United States.
Mapping German Migration
Zeit Online analyzed and visualized the data of approximately six million internal relocations in Germany after the country’s reunification from 1991 to 2017. It also highlighted the consequences of the exodus of about 3.6 million people, almost a quarter of the original population in East Germany, from the East to the West.
Gaps in DataViz Pedagogy
Enrico Bertini, host of the Data Stories podcast, outlined several concepts that he feels are lacking in the teaching of data visualization, including ideas on data transformation, sorting and uncertainty.
Data Journalism Intro
Al Jazeera produced a concise and practical introduction to data journalism using case studies from Arab media. It has sections on dispelling myths about data journalism, getting data, cleaning and analyzing data, as well as delivering your story.
Divide Between National/Local Media
The Wall Street Journal examines the US news industry and highlights a stark divide between big national players and small local outlets. Local media have been hardest hit by tech giants siphoning ad dollars away and are in danger of vanishing.
https://twitter.com/millie/status/1125080608429019137
Storytelling With Numbers
Data viz expert Alberto Cairo talks about the key to the future of data journalism and possible innovations in borrowing techniques from other fields, such as film documentaries and video games.
New Digital Magazine
A group of designers, programmers and researchers formed Parametric Press to showcase interactive and dynamic writing. The first issue Science + Society is out now and each article comes with its own open source code, digital object identifier and an offline archive to preserve the article.
Populism’s Popularity
Where are populist parties well received in the European Union? Der Spiegel analyzed 28 European countries and shows where populism has won the public’s votes in the past 20 years. Data on Github. (In German.)
Analyzing Child Abuse Data
Data Stories Pakistan analyzed police records on child rape and abuse cases since 2017 and found a worrying number of 2,841 child sexual abuse cases reported.
GoogleSheets4
Googlesheets4, by Jenny Bryan, provides an R interface to Google Sheets via the Sheets API v4. It is a reboot of the existing googlesheets package.
https://twitter.com/angelozehr/status/1123567426065637377
People to Follow
Looking for inspiration on Twitter? The Wire’s Aditya Jain suggests you to follow a list of people doing cool data viz and visual journalism stuff.
https://twitter.com/whaleandpetunia/status/1124551378410409985
Thanks, once again, to Marc Smith of Connected Action for gathering the links and graphing them. The Top Ten #ddj list is curated weekly.
 Eunice Au is GIJN’s program coordinator. Previously, she was a Malaysia correspondent for Singapore’s The Straits Times, and a journalist at the New Straits Times. She has also written for The Sun, Malaysian Today and Madam Chair.
For a look at Marc Smith’s mapping on #ddj on Twitter, check out this map.

My Favorite Tools: Venezuela’s Lisseth Boon on Design and Data Visualization

Basic Data Journalism Tips for Editors

Document of the Day: Visual Vocabulary
Data Journalism Top 10: Organ Donations, EU Drug Use, Layoffs Language, and Russian Censorship

Sigma Awards: 10 Lessons for Data Journalists Around the World
Data Journalism Top 10: Russia’s Mistakes, Ukrainian Refugees, Hong Kong’s COVID Crisis, Best Dataviz
My Favorite Tools: Venezuela’s Lisseth Boon on Design and Data Visualization

This work is licensed under a Creative Commons Attribution-NoDerivatives 4.0 International License
Republish our articles for free, online or in print, under a Creative Commons license.
Republish this article
This work is licensed under a Creative Commons Attribution-NoDerivatives 4.0 International License
Read Next
Data Journalism Data Journalism Top 10
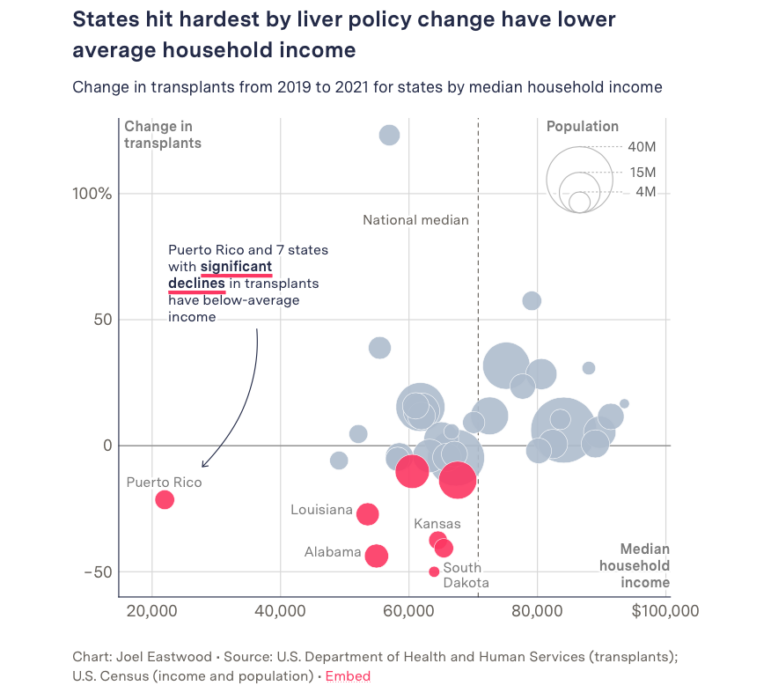
Data Journalism Top 10: Organ Donations, EU Drug Use, Layoffs Language, and Russian Censorship
GIJN’s weekly curation of the most popular data journalism stories on Twitter features a look the impact of changes to organ donation rules in the US, drug usage in Europe based on wastewater analysis, a text analysis of layoff memos written by tech industry chief executives, and an examination of protests across Russia in 2022.
Data Journalism News & Analysis
Sigma Awards: 10 Lessons for Data Journalists Around the World
The Sigma Awards celebrate the best in data journalism from around the world. Speaking at the Perugia International Journalism Festival, three of the founders of the award highlighted the best projects of recent years and pointed to what journalists can learn from these data stories.
Data Journalism
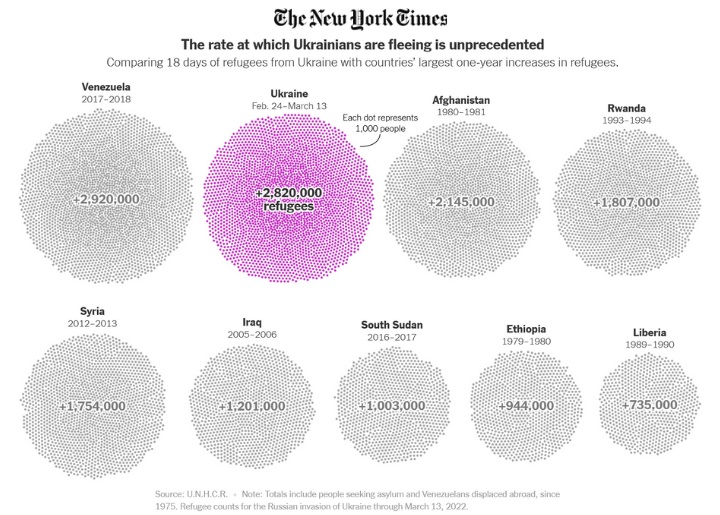
Data Journalism Top 10: Russia’s Mistakes, Ukrainian Refugees, Hong Kong’s COVID Crisis, Best Dataviz
In GIJN’s weekly Top 10 in Data Journalism, we look at Russia’s overconfident war plans, the Ukrainian refugee crisis, the potential for a new malaria vaccine, and the ongoing COVID-19 catastrophe in Hong Kong.
Data Journalism My Favorite Tools
My Favorite Tools: Venezuela’s Lisseth Boon on Design and Data Visualization
Since her arrival at Runrun.es, Lisseth Boon has conducted investigations on human rights violations, gold trafficking, illegal mining, and environmental crimes, many of them recognized with national and international awards. Her team has also worked with media platforms both inside and outside of Venezuela such as Consejo de Redacción and Connectas in Colombia, Convoca in Perú, and Mongabay. It has also participated in transnational collaborative projects such as the Panama Papers, Fincen Files, Swiss Connection, Lava Jato (Operation Car Wash), Vigila La Pandemia, and Tierra de Resistencia.