Six Case Studies in Computational Journalism

The 2019 Computation + Journalism Symposium, held in Miami, brought together journalists and computer and data scientists. Photo: Courtesy of Storybench
How often is social media used as a source in news stories? Can a decision tree algorithm generate tens of thousands of 250-word stories? And what is belief-driven data journalism?
Those questions lie at the heart of some of the research projects at the intersection of computational tools and journalism presented earlier this year at the Computation + Journalism Symposium, held at the University of Miami and sponsored by the Knight Foundation. Below are a few of the projects that were particularly promising.
How to Generate 40,000 Articles in Five Minutes

One of Tamedia’s automated articles.
The Swiss media company Tamedia presented its findings from Tobi, a decision tree algorithm that’s capable of generating tens of thousands of articles in minutes. Tobi’s 250-word stories are created using reporter-generated templates. The algorithm was responsible for dragging and dropping in collected data to better personalize local content.
What did we learn? Automation in newsrooms can be valuable if you have a long-tail audience, and readers have responded positively to automated content in the past. But who should byline a piece if a reporter and a robot have both worked on it?
Algorithmic News Aggregators
Leveraging crowdsourced auditing, researchers at Northwestern University endeavored to get to the bottom of the Apple News trending stories algorithm. The aim of the research was to determine what level of customization the trending stories algorithm supported from user to user by collecting data from Amazon Mechanical Turk and through their own semi-automated data collection system.
What did we learn? While Apple’s handpicked top stories showcase a wide range of news sources, their algorithm chose its stories from a considerably more limited pool. It also skews more heavily toward soft news related to entertainment, sports and celebrities.
Textual Analysis and Viz Tools Built With R Shiny
While word cloud visualizations and similar types of simple tools are widely available on the web, the more sophisticated textual analysis software and code unfortunately remain the domain of experts and users of languages like R and Python. That’s why Northeastern University’s School of Journalism decided to develop a suite of apps that allow any user – journalist, researcher, layperson – to drop in a text file or spreadsheet and harness the power of R’s textual and sentiment analysis packages through public-facing R Shiny apps.
What did we learn? Sentiment analysis is frequently misunderstood and these apps provide some transparency into how those scores are calculated. These apps, though still only prototypes, point to the possibility of a broader ecosystem of similar deadline-friendly apps for newsrooms that could provide them with greater analytical power and higher-level insights, specifically around textual and sentiment analysis of political speeches or social media ads, for instance.

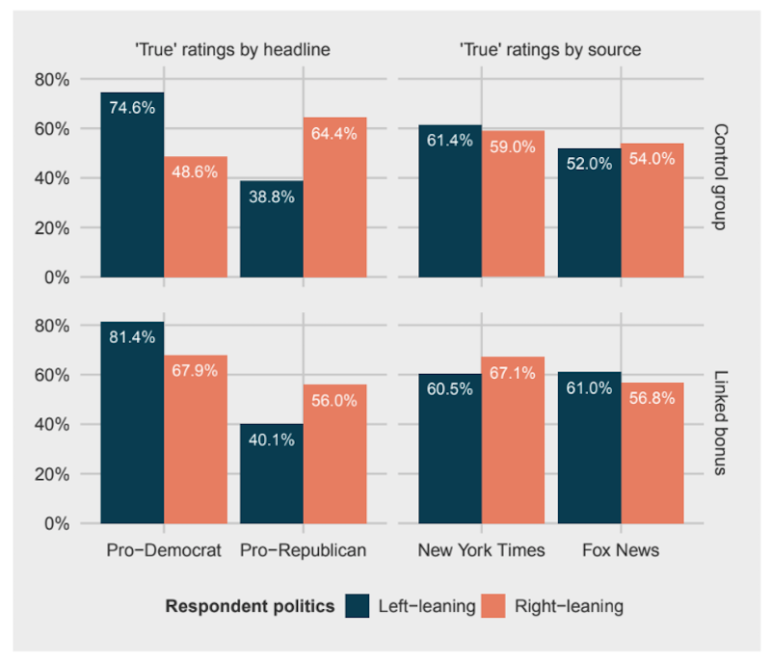
Expressive Responding in Political News Evaluation
Researchers from Cornell University, Cornell Tech and Technion wanted to determine how strongly the source of a news story might affect a reader’s trust in that story. Respondents evaluated multiple headlines from multiple news sources, and were asked whether they believed the headline to be credible.
What did we learn? Based on this admittedly limited pool of respondents, it seemed that subjects were more likely to believe headlines that aligned with their own personal politics, and that the political leanings of a headline impacted credibility more than the source itself did.
Belief-Driven Data Journalism
This study from Northwestern University proposes that belief-driven data journalism results in stronger reader engagement. They looked at four case studies centered around four different news stories, with each representing key data in different ways. Using pre-existing psychological research, they considered how different visualizations might be interpreted by the average reader, and they used that information to inform their development of a tool that generates reader-facing belief-driven visualizations.
What did we learn? Belief-driven data journalism is a ripe area of opportunity. Future research, possibly involving more robust methods of input, such as voice input, will provide more insight into how direct interaction between readers and data might affect the reader’s engagement and beliefs.

Social Media Sources in News Articles
Researchers at the University of Oklahoma and the University of Mississippi examined approximately 60,000 news articles to audit the usage of social media as a source. In a country where tweets from the president often drive news coverage, they were interested in seeing how often these occasionally unreliable sources are cited in stories across a wide range of media outlets.
What did we learn? Social media content in news has doubled in the last five years, and is used more by small outlets than by mainstream outlets. Moreover, Twitter is preferred as a social media source more than Facebook is. Social media content is cited in political news across coverage of all sizes.

This article first appeared in Storybench and is reproduced here with permission.
 Gibby Free is a student majoring in computer science and journalism at Northeastern University. She produces academic research related to digital storytelling, textual analysis and internet archiving.

GIJC23 – Holding Algorithms Accountable Through Collaboration

Document of the Day: Algorithms for Journalists

AI Accountability Reporting Guide

Guide to Mapping Analysis Using QGIS
Data Journalism Top 10: Bats and the Next Pandemic, China’s Electric Battery Dominance, and Brazil’s Healthcare ‘Holes’

Data Journalism Top 10: Thanksgiving Dangers, Vaccine Tracker, Crosswords Diversity, Golf Swings, Facebook Fact-checks
Data Journalism Top 10: Visualizing Hurricanes, Predicting Wildfires, Social Media Algorithms, Trump Loyalty Index
Data Journalism Top 10: Beirut Blast, Predicting Crime, US Election Simulators, and COVID in Ukraine

This work is licensed under a Creative Commons Attribution-NoDerivatives 4.0 International License
Republish our articles for free, online or in print, under a Creative Commons license.
Republish this article
This work is licensed under a Creative Commons Attribution-NoDerivatives 4.0 International License
Read Next
Data Journalism Data Journalism Top 10
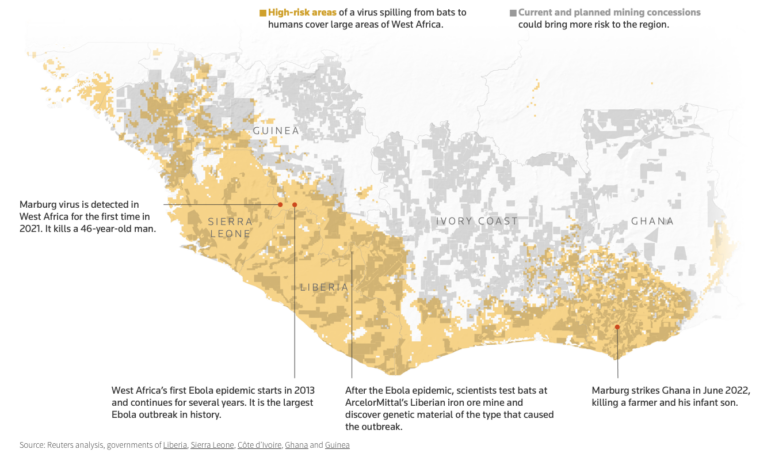
Data Journalism Top 10: Bats and the Next Pandemic, China’s Electric Battery Dominance, and Brazil’s Healthcare ‘Holes’
GIJN’s weekly, curated look at the Top 10 in Data Journalism highlights bats and predicting the location of the next pandemic, China’s electric battery dominance, and mapping out Brazil’s healthcare “holes.”
Data Journalism
Data Journalism Top 10: Thanksgiving Dangers, Vaccine Tracker, Crosswords Diversity, Golf Swings, Facebook Fact-checks
Around the world, people are toning down their celebrations in a bid to mitigate spread of the coronavirus. The latest casualty: Thanksgiving. Our NodeXL #ddj mapping from November 16 to 22 found FiveThirtyEight’s timely piece explaining the risk of COVID-19 transmission from even small Thanksgiving dinner gatherings. Also popular: The New York Times tracking the status of all vaccine trials in progress, and The Pudding analysis of race and gender in crossword puzzles from five major US news publications.
Data Journalism
Data Journalism Top 10: Visualizing Hurricanes, Predicting Wildfires, Social Media Algorithms, Trump Loyalty Index
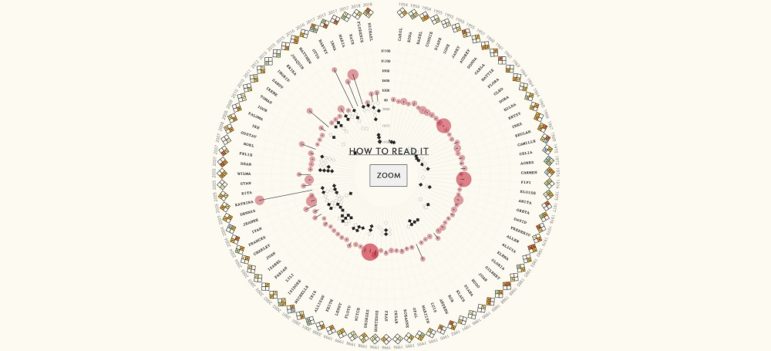
How does climate change increase the likelihood of weather extremes? Our NodeXL #ddj mapping from October 12 to 18 finds ProPublica examining how the warming global climate exacerbates wildfire activity, and designer Will Chase visualizing some of the most destructive hurricanes with an interactive wheel graphic. The Financial Times is summarizing key trends of the pandemic using charts, maps, and graphics, while The Markup announced its latest project looking into the black box algorithms of social media platforms.
Data Journalism
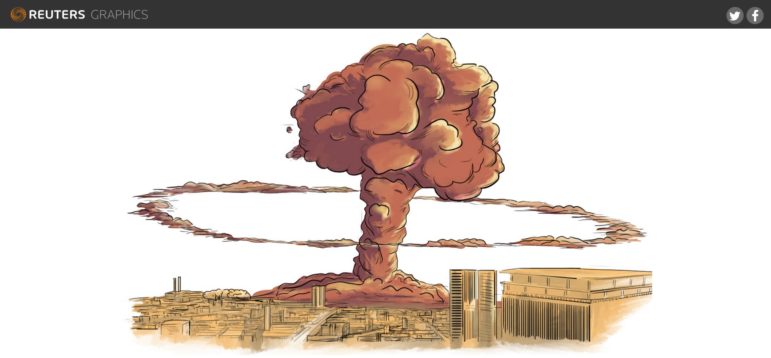
Data Journalism Top 10: Beirut Blast, Predicting Crime, US Election Simulators, and COVID in Ukraine
What was the magnitude of the Beirut port blast and how did it compare to other infamous explosions in history? Our NodeXL #ddj mapping from August 31 to September 6 finds Reuters illustrating just how powerful last month’s blast was in relation to the Chernobyl disaster and other explosions. The Tampa Bay Times highlighted how a county sheriff’s office is using an algorithm to supposedly predict and intercept the criminals of the future, while The New York Times used satellite maps to show how physical and political geographies interact across the United States. ESPN has been looking into the potential of people in college football crowds to become COVID-19 super-spreaders, and Slate analyzed the overuse of the word “murmur” in the popular Twilight novel series.