GIJN’s Data Journalism Top 10: France’s Shocking Yellow Vest Injuries, Yield Curve Music, Migration Maps

Step-By-Step Guide for Journalists on the Basics of Google Sheets

Tipsheet for Using Ocean Data in Your Investigations

No Coding Required: A Step-by-Step Guide to Scraping Websites With Data Miner

GIJC23 – The Future of Data Journalism: New Analytical Tools, Data Visualization, and AI
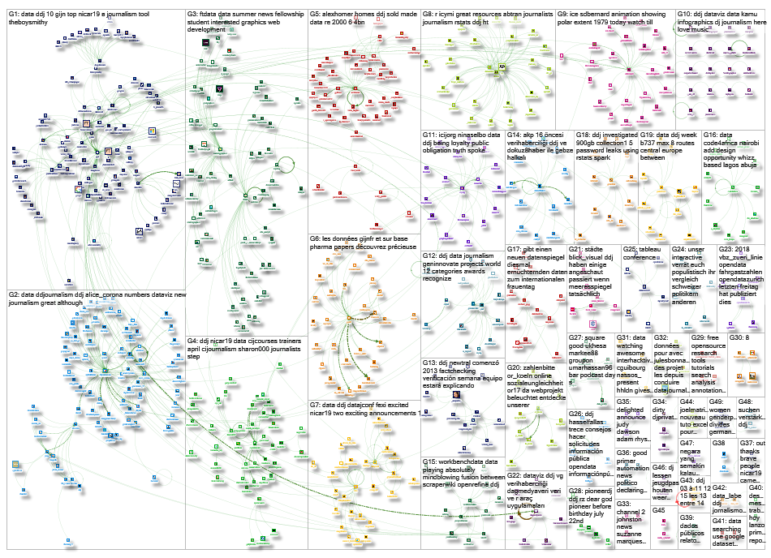
What’s the global data journalism community tweeting about this week? Our NodeXL #ddj mapping from March 11 to March 17 finds @davduf‘s award-winning exposé of Yellow Vest injuries in France, @theboysmithy making music out of the yield curve, and @alisonkilling on mapping two fictional migrants’ journeys to Europe.
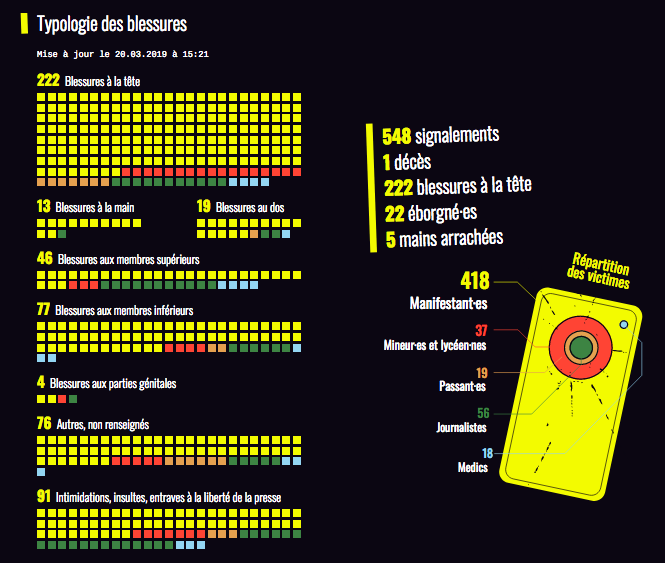
Yellow Vest Injuries Exposed
David Dufresne just won the grand prize in France’s top journalism awards for his data-driven project “Allô Place Beauvau,” on the shocking amount of police violence against protesters from the Yellow Vest movement. By crowdsourcing incidents on social media, he chronicled 548 incidents, including 222 head injuries, 22 lost eyes and 5 severed hands.
Yielding Music
The Financial Times’ data visualization editor Alan Smith had fun with sonification for his latest Chart Doctor column: He turned the iconic yield curve, which shows the yield of different US government bonds, into a piece of music. The resulting four-octave range suits an instrument like the marimba, he found.
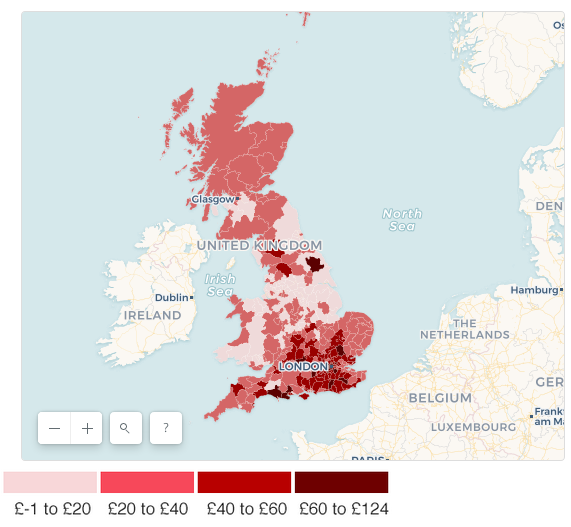
Right to Buy
The BBC created an interactive map highlighting the scale of property flipping under the “Right to Buy” program, which allows UK council tenants to buy their homes at a reduced price. Detractors of the program have renewed calls for it to be suspended in England, after it was stopped in Scotland and Wales.
Migration Trail
The MapBox blog has an interview with Alison Killing, the creator of Migration Trail, an interactive project that uses maps and data visualization to tell the story of two fictional migrants traveling to Europe. She explains that she used lots of open data on displaced people from sources like the United Nations High Commissioner for Refugees data portal, the European Commission’s statistics division, the Passport Index and the International Organisation of Migration’s Missing Migrant project.
Covering Immigration With Data
The awesome NICAR slides keep coming: This time they’re from a session on covering immigration with data, from Christine Mehta, Nausheen Husain and Ryan McNeill.
Archiving Data Projects
Ever wanted to archive your data project — with more than a screenshot? Try out this work-in-progress app up on GitHub which captures archival packages of data journalism websites. And remember to thank your librarians (in this case, NYU librarians).
R in Turkish
For Turkish speakers, here’s a practical book on using R for data journalism, written by Kerim Göztepe of Sakarya University. It’s free to download here.
Infographics and Dataviz
5W Infographics is offering two workshops on information graphics and data visualization featuring Juan and Samuel Velasco, who have created graphics for numerous media outlets in the United States and Spain. The two-day workshop will be offered in San Francisco on March 21-22 and in Washington, DC on April 11-12.
Data Workshops
The Center for Investigative Journalism is offering several courses in London this spring, including a one-day workshop on finding stories with data and a two-day workshop on data-driven investigations.
Fellowships Across Europe
The European Journalism Centre and the Google News Initiative are offering paid summer fellowships in newsrooms across Europe, including many focused on data journalism.
See the full list here. The deadline to apply is April 1.
Thanks, once again, to Marc Smith of Connected Action for gathering the links and graphing them.
 Gaelle Faure is GIJN’s associate editor. Previously, she worked for France 24, where she specialized in social newsgathering and verification. She has also worked as an editor for News Deeply and reported for Time Magazine.
For a look at Marc Smith’s mapping on #ddj on Twitter, check out this map.
Step-By-Step Guide for Journalists on the Basics of Google Sheets
Tipsheet for Using Ocean Data in Your Investigations
No Coding Required: A Step-by-Step Guide to Scraping Websites With Data Miner
GIJC23 – The Future of Data Journalism: New Analytical Tools, Data Visualization, and AI

From Data to Storytelling: Concept and Design Tips from the Financial Times’ John Burn-Murdoch

Tracking US Migrant Detention Data: What Journalists Need to Understand

How Middle Eastern Data Outlets Use Data to Challenge Narratives and Advance Accountability

Documenting the Unidentified Graves of Migrants in Europe’s Borderlands

This work is licensed under a Creative Commons Attribution-NoDerivatives 4.0 International License
Republish our articles for free, online or in print, under a Creative Commons license.
Republish this article
This work is licensed under a Creative Commons Attribution-NoDerivatives 4.0 International License
Read Next
Data Journalism
From Data to Storytelling: Concept and Design Tips from the Financial Times’ John Burn-Murdoch
The chief data reporter for the Financial Times discusses how he considers the use of text, color, and annotation to aid visual storytelling through charts and graphics.
Data Journalism News & Analysis
Tracking US Migrant Detention Data: What Journalists Need to Understand
The US government’s detained immigrant population flatlined in April, but there’s more to the numbers than meets the eye. Here’s what journalists need to know about the data.
Data Journalism MENA Focus Week
How Middle Eastern Data Outlets Use Data to Challenge Narratives and Advance Accountability
Data journalism in the Middle East has been driven by organizations that have produced collaborations and projects that combine innovative techniques with nuanced local knowledge.
Data Journalism How They Did It
Documenting the Unidentified Graves of Migrants in Europe’s Borderlands
This investigation sought to answer key questions that no government could answer: What happens when someone goes missing at Europe’s borders? And how many burial sites are there across Europe?