Document of the Day: DataViz Cheatsheet
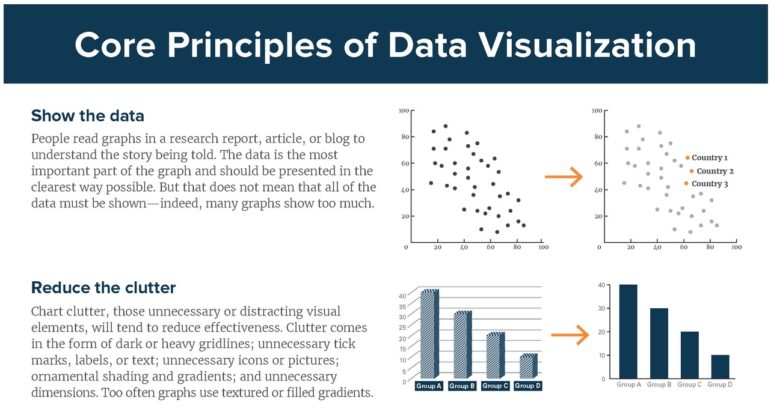
Economist Jonathan Schwabish is on a mission to help people, including data journalists, do a better job communicating their data. He created a handy data visualization cheatsheet with straightforward key principles for creating data visualizations. Remember: avoid 3D, make labels easy to read and try small multiples. Download the full cheatsheet for free here.


GIJC23 – When the Data Aren’t There: Building Your Own Datasets

Basic Data Journalism Tips for Editors

My Favorite Tools: Venezuela’s Lisseth Boon on Design and Data Visualization
Tips for Building a Database for Investigations

From Data to Storytelling: Concept and Design Tips from the Financial Times’ John Burn-Murdoch

Tracking US Migrant Detention Data: What Journalists Need to Understand

Data Don’ts: Expert Tips to Avoid Misleading Audiences With Numbers

How The Pudding Used Data Visualizations to Recontextualize the Story of Climate Change

This work is licensed under a Creative Commons Attribution-NoDerivatives 4.0 International License
Republish our articles for free, online or in print, under a Creative Commons license.
Republish this article
This work is licensed under a Creative Commons Attribution-NoDerivatives 4.0 International License
Read Next
Data Journalism
From Data to Storytelling: Concept and Design Tips from the Financial Times’ John Burn-Murdoch
The chief data reporter for the Financial Times discusses how he considers the use of text, color, and annotation to aid visual storytelling through charts and graphics.
Data Journalism News & Analysis
Tracking US Migrant Detention Data: What Journalists Need to Understand
The US government’s detained immigrant population flatlined in April, but there’s more to the numbers than meets the eye. Here’s what journalists need to know about the data.
Data Journalism
Data Don’ts: Expert Tips to Avoid Misleading Audiences With Numbers
At a NICAR 2025 panel, data journalism experts discussed nuanced number errors that watchdog reporters often make that can confuse readers and disrupt story angles.
Climate Data Journalism
How The Pudding Used Data Visualizations to Recontextualize the Story of Climate Change
What does climate change feel like? How will your city’s climate shift, 50 years from now? Data scientist Derek Taylor explains his latest piece.