Improve Your Data Literacy: 16 Blogs to Follow in 2016

Step-By-Step Guide for Journalists on the Basics of Google Sheets

Tipsheet for Using Ocean Data in Your Investigations

No Coding Required: A Step-by-Step Guide to Scraping Websites With Data Miner

GIJC23 – The Future of Data Journalism: New Analytical Tools, Data Visualization, and AI
 Editor’s Note: This is a curated list by the School of Data, a project by the Open Knowledge Foundation and Peer 2 Peer University that works to empower civil society organizations, journalists, and citizens with skills to use data in creating more equitable and effective societies.
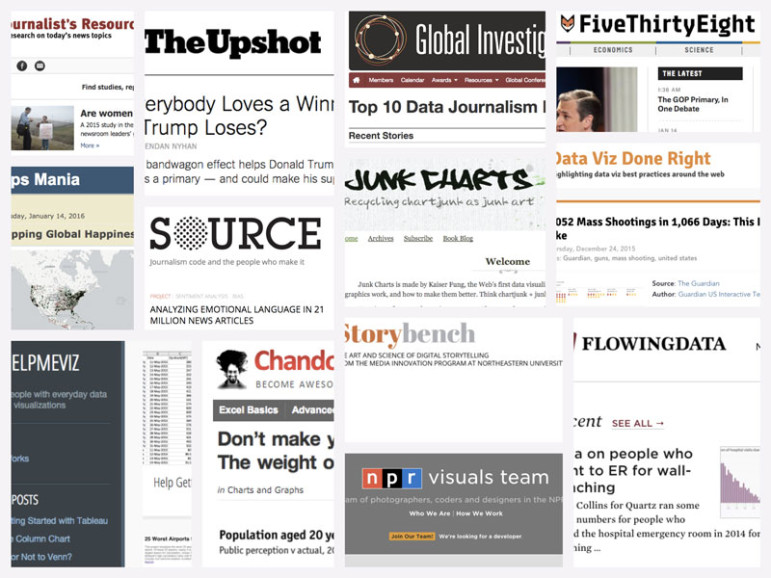
Data literacy is a never-ending process. Going to workshops and hands-on practice are important, but to really become acquainted with the “culture” of data literacy, you’ll have to do a lot of reading. Don’t worry, we’ve got your back: below is a curated list of 16 blogs to follow in 2016 if you want to: improve your data-visualization skills; see the best examples of data journalism; discover the methodology behind the best data-driven projects; and pick-up some essential tips for working with data.
Using Feedly as your RSS Reader? Check out our shared collection which includes the blogs mentioned below plus other blogs!
Data Visualization
Data Viz Done Right
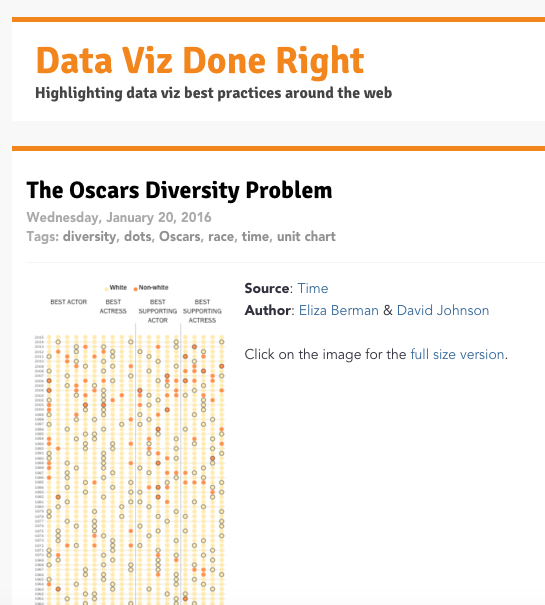 This website, by Andy Kriebel, curates good examples of dataviz around the web, highlighting what was great, and also what could have been done better. Each post is quick and easy to read, and they add up to form a set of good practices to keep in mind when doing a data visualization.
- Website link: http://www.datavizdoneright.com/
- Frequency: 1 article/week
Flowing Data
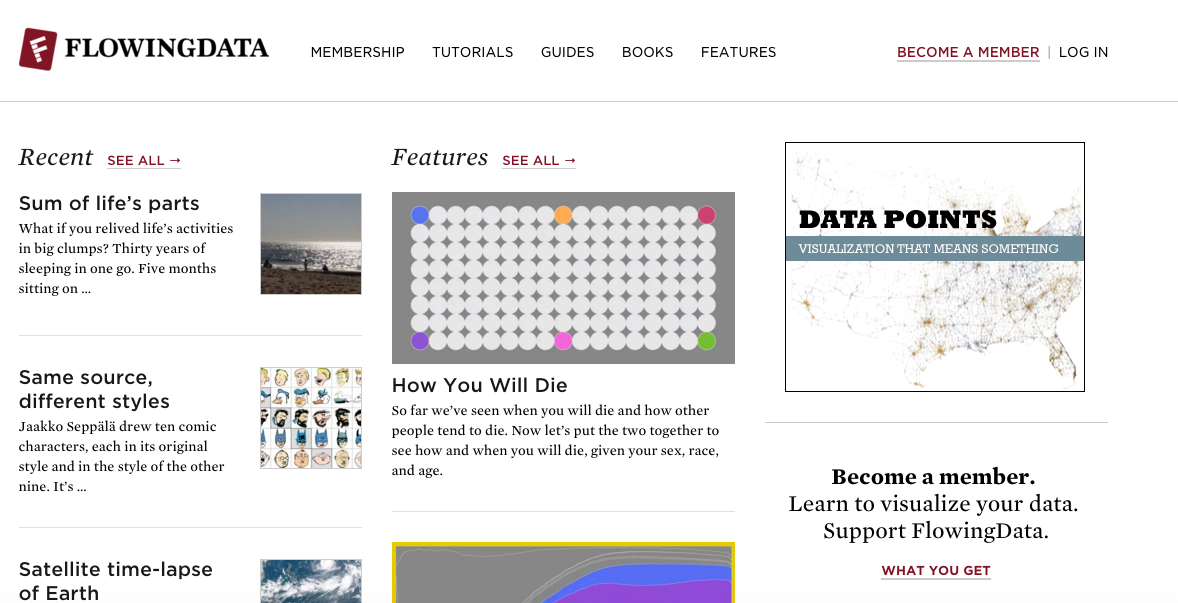 Flowing Data is Nathan Yau’s full-time job, and it shows. Regularly updated with great original or curated content about data visualization, this blog is a good way to keep track of the major trends and events in the field. Other sections of the website feature tutorials for purchase and guides.
- Website link: http://flowingdata.com
- Twitter: @flowingdata
- Frequency: 9 articles/week
Google Maps Mania
 Do you like maps? Everybody likes maps. Managed by map-addict Keir Clarke for more than 10 years, this blog is the go-to resource for following the development of digital cartography. Don’t be fooled by the name, all digital maps are featured, not only Google ones.
- Website link: http://googlemapsmania.blogspot.co.za/
- Twitter: @gmapsmania
- Frequency: 24 articles/week
Junk Charts
 Prominent data visualization expert Kaiser Fung set out to become the web’s first data-visualization critic. The result is a website which regularly deconstructs dataviz work, even from top publications, often proposing an alternative visualisation. The articles on Junk Charts regularly make ripples through the web, attracting praise, criticism, but most importantly, prompting discussion.
- Website link: http://junkcharts.typepad.com/
- Twitter: @junkcharts
- Frequency: 2 articles/week
Visual Loop
 Visual Loop is the ultimate data visualization web repository. Founded as simple blog in 2010 by Tiago Veloso, it grew to become the most active and up-to-date curation space for data visualization, in all formats. Featuring interviews with designers along with event announcements, this is the blog to follow to get inspiration.
- Website link: http://visualoop.com/
- Twitter: @visualoop
- Frequency: 3 articles/week
Data In the News
FiveThirtyEight
 Rather than simply having data journalists, FiveThirtyEight is data journalism. Founded by Nate Silver, a renowned statistician who reached stardom after predicting the 2008 and 2012 elections while blogging for the New York Times, FiveThirtyEight represents the boldest attempt to do pure data journalism. It works remarkably well, and is an inspiration for all data journalists, seasoned and aspiring ones alike.
- Website link: https://fivethirtyeight.com/
- Twitter: @FiveThirtyEight
- Frequency: 40 articles/week
NYT – The Upshot

After the departure of Nate Silver, the New York Times decided to aim even higher by starting The Upshot, a data journalism corner dedicated to politics, policy, and economic analysis. It’s an ambitious and high-quality take on data journalism, with approachable articles on social issues (politics, nutrition…) mixed with innovative interactive data visualizations.
- Website link: http://www.nytimes.com/upshot/
- Twitter: @UpshotNYT
- Frequency: 21 articles/week
Washington Post Information Graphics
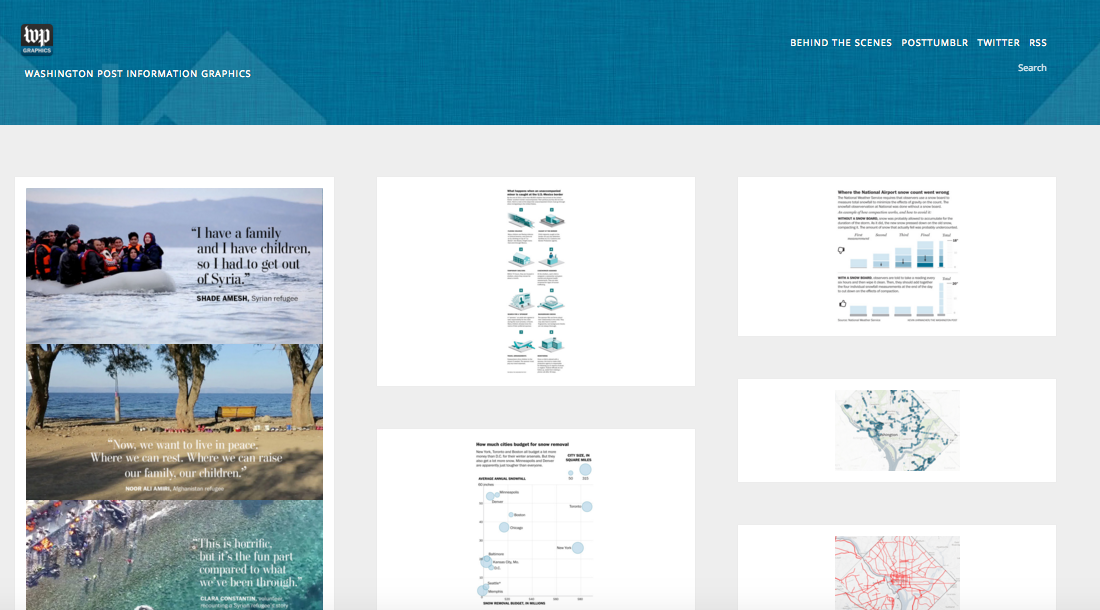 The Washington Post Information Graphics blog is an unadulterated look at the data journalism articles produced by the « WaPo ». It is not only a great source of inspiration for anyone interested in dataviz, but a great source of quality articles, without all the fluff of the main website.
- Website link: http://postgraphics.tumblr.com/
- Twitter: @PostGraphics
- Frequency: 4 articles/week
Understanding Uncertainty
 David Spiegelhalter is the maestro behind this ever-useful website, which regularly takes on news articles (but not exclusively) which make a bad job of reporting on the risk/probability/chance of something happening. It is a great read to cut through sensationalist claims, as well as a source of examples on how to deal with uncertainty in reporting.
- Website link: http://understandinguncertainty.org/
- Frequency: Less than 1 article/week
Global Journalism Investigative Network
 The GJIN, as a whole, is an extensive resource for journalists, but its series of curated top 10 data journalism links of the week is a great way of tracking the #ddj articles or news that made the rounds on Twitter for any particular week.
- Website link: https://gijn.org/series/top-10-data-journalism-links/
- Twitter: @gijn
- Frequency: 1 article/week
Behind The Scenes
NPR Visuals Team Blog
 A nerdier pick than the rest of the selection, the NPR Visual Teams blog is still an amazing place to see the methodology behind outstanding data journalism projects. Additionally, the NPR Team maintains several open source tools for data journalism which are described on the blog.
- Website link: http://blog.apps.npr.org/
- Twitter: @nprviz
- Frequency: Less than 1 article/week
Source
 No less nerdy than the NPR blog, the Source blog (a Mozilla/Open News project) is more varied in its content, thanks to regular blog posts by top data journalists from a wide variety of newsrooms. Alternating behind-the-scenes articles, guides, tutorials and event round-ups, this blog is a must-have in the RSS reader of every data journalist.
- Website link: https://source.opennews.org
- Twitter: @source
- Frequency: 2 articles/week
Storybench
 Storybench is a collaboration between the Media Innovation track at Northeastern University’s School of Journalism and Esquire magazine. A relative newcomer in the sphere of data journalism blogs, it features high quality articles, providing an « under the hood » look at examples of digital journalism, accompanied by interviews with the journalists who make them.
- Website link: http://www.storybench.org/
- Twitter: @storybench
- Frequency: 2 articles/week
Learning To Work with Data
Chandoo
 Data journalists love spreadsheets. And why wouldn’t they? They’re so flexible! Chandoo.org is the place to go if you want to maximise this potential flexibility, or just pick some nice tricks that will make your work faster. Chandon focuses on Excel, but thankfully most of the tricks of use to data journalists will be available in other, similar software.
- Website link: http://chandoo.org/wp/
- Twitter: @r1c1
- Frequency: 2 articles/week
HelpMeViz
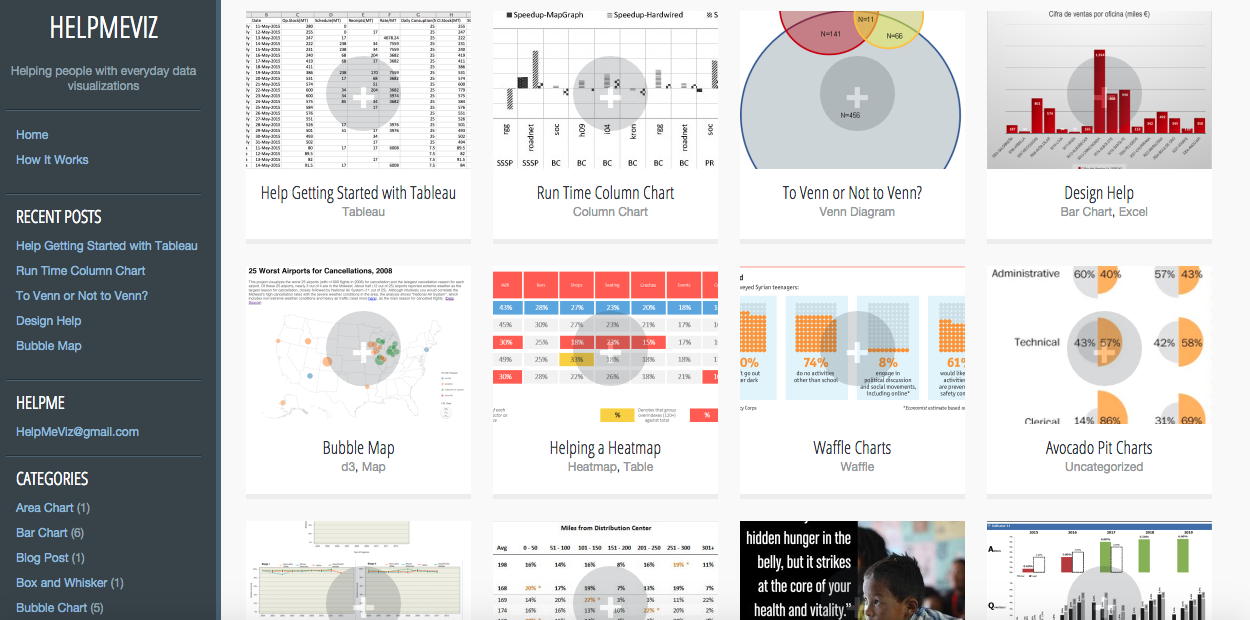 HelpMeViz’s tagline is « helping people with everyday data visualization ». Whilst submitting your dataviz issue to the community can be really helpful, the real value of the website is in the aggregation of all the posts, each representing a small dataviz challenge. If you ever wondered in how many ways you could tackle a data visualization problem, HelpMeViz is there for inspiration.
- Website link: http://helpmeviz.com/
- Twitter: @HelpMeViz
- Frequency: Less than 1 article/week
Journalist’s Resource
 The Journalist’s Resource tackles a niche aspect of data literacy: understanding research papers. Mixing regular round-ups of research around specific topics with quality guides about understanding research terms or working with numbers (check out their amazing tip sheets), this blog from the Shorenstein Center of Harvard Kennedy School is a resource all journalists (and especially North American ones) should follow.
- Website link: http://journalistsresource.org/
- Frequency: 6 articles/week
Do you believe that some obvious blogs are missing? Tweet them to us at @Schoolofdata or on Facebook. And check out our Feedly shared collection, which includes more than the blogs mentioned above!
 Cedric Lombion is the communications and community manager for the School of Data. Based in Bordeaux, France, he is a consultant in communications and open data. @clombion. This story is cross-posted with permission from the School of Data website.
Step-By-Step Guide for Journalists on the Basics of Google Sheets
Tipsheet for Using Ocean Data in Your Investigations
No Coding Required: A Step-by-Step Guide to Scraping Websites With Data Miner
GIJC23 – The Future of Data Journalism: New Analytical Tools, Data Visualization, and AI

How the Hindu Is Embedding AI Into Its Data Journalism

Developing a Data State Of Mind: Key Tips for Editors

2026 Sigma Awards for Data Journalism Open for Entries – Deadline Extended

5 Tips for Slashing FOIA Costs (Including How One Reporter Lowered a Records Request Fee from $2,800 to Just $29)

This work is licensed under a Creative Commons Attribution-NoDerivatives 4.0 International License
Republish our articles for free, online or in print, under a Creative Commons license.
Republish this article
This work is licensed under a Creative Commons Attribution-NoDerivatives 4.0 International License
Read Next
Data Journalism
How the Hindu Is Embedding AI Into Its Data Journalism
LLMs are quietly reshaping data journalism workflows at The Hindu, helping reporters process vast document sets, write scripts and build interactive tools.
Data Journalism
Developing a Data State Of Mind: Key Tips for Editors
Data is woven into how journalists cover everything from local government spending to global climate change patterns, but for editors without a specialist background, it can be daunting.
Data Journalism
2026 Sigma Awards for Data Journalism Open for Entries – Deadline Extended
The Sigma Awards celebrate the best data journalism from around the world. Submissions are now open for data projects published in 2025.
Reporting Tools & Tips
5 Tips for Slashing FOIA Costs (Including How One Reporter Lowered a Records Request Fee from $2,800 to Just $29)
With a little research and negotiation, reporters can slash the cost of obtaining records bundles and speed up the government’s response in the process.