Accessibility Settings

color options

monochrome muted color dark

reading tools

isolation ruler

Tag

visual storytelling

3 posts

Reporting Tools & Tips

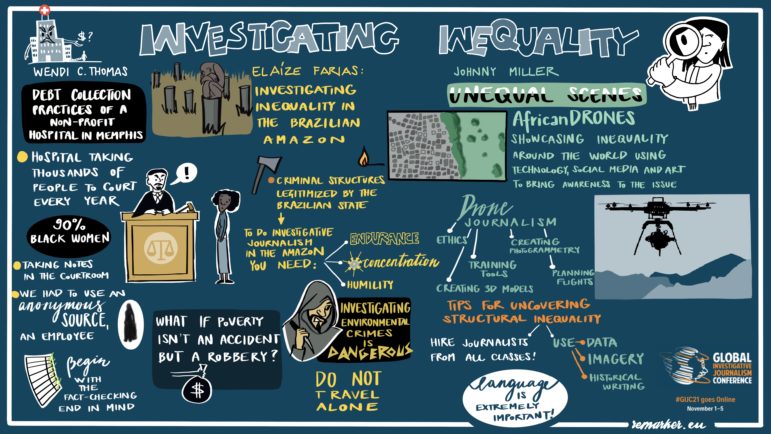
Immersion and Imagery: Keys to Investigating Systemic Inequality

Spending time with vulnerable communities and focusing on systems of exploitation were the central takeaways from a #GICJ21 panel on covering inequality, in which journalists based in three of the world’s most unequal societies — Brazil, South Africa, and the United States — shared tips on how to tackle this global crisis.

Structuring visual narratives, by Gurman Bhatia

Data Journalism

Data Journalism Top 10: Women’s Careers, Vitamin D, Visual Stories, Electric Cars, Japan’s Ghost Towns

On the one-year anniversary of the COVID-19 crisis being declared a global pandemic, outlets around the world looked back on how the coronavirus has transformed our lives. Our NodeXL #ddj mapping from March 8 to 14 found a comprehensive summary of how the health crisis unfolded in the United States by The Washington Post, and a look at the COVID-19 crisis in Hungary. In this edition, we also feature The Economist’s interactive tool estimating the risk posed by COVID-19 based on a person’s health, a story about the ghost towns in Fukushima by NPR, and an analysis of the future of electric cars by The New York Times.