Accessibility Settings

color options

monochrome muted color dark

reading tools

isolation ruler

Tag

mapping

78 posts

Data Journalism

GIJN’s Data Journalism Top 10: Fall Foliage, Housing Data, Knife Crimes, Charts vs. Text

What’s the global data journalism community tweeting about this week? Our NodeXL #ddj mapping from October 7 to 13 finds The New York Times tackling the topic of auto emissions as a significant climate problem, The Washington Post mapping the colors of America’s fall foliage across the nation, St. Louis Post-Dispatch sharing its newsroom process in data transparency, and Nicholas Strayer offering a tutorial to build your own cool resume using R.

Data Journalism

GIJN’s Data Journalism Top 10: Burning Amazon, Mass Shootings, Hungarian Kings

What’s the global data journalism community tweeting about this week? Our NodeXL #ddj mapping from August 19 to 25 finds Bloomberg mapping the alarming degradation of the Amazon rainforest, Alyssa Fowers discussing variations in visualizing mass shootings and their corresponding impact on readers, Data Carpentry sharing tips for organizing data in spreadsheets, and Atlatszo visualizing the succession of Hungarian kings.

Data Journalism

GIJN’s Data Journalism Top 10: Avengers on the Move, Nonprofit Tax Filings, Visualizing Uncertainty

What’s the global data journalism community tweeting about this week? Our NodeXL #ddj mapping from June 3 to 9 finds @sto3psl mapping places the Avengers visited in Europe, @fedfragapane visualizing which elements in the periodic table are in danger of running out, @srfdata highlighting the top worries of the Swiss and @propublica doing researchers and journalists a huge public service by making 3 million US nonprofit records text-searchable.

Data Journalism

GIJN’s Data Journalism Top 10: Populism Popularity, DataViz Pedagogy, National vs. Local Media, German Migration

What’s the global data journalism community tweeting about this week? Our NodeXL #ddj mapping from April 29 to May 5 finds @zeitonline mapping German migration post-reunification, @FILWD pointing out the gaps in current data visualization teaching syllabi, @AlJazeera launching its data journalism introductory guide, and @WSJ highlighting the stark divide between national and local media in the United States.

Reporting Tools & Tips

10 Tips on Investigating Extrajudicial Killings: A Case Study from the Philippines

Reporting on extrajudicial killings — murders carried out by state actors or by non-state vigilantes with the cover of state sanction — poses specific challenges to investigative journalists. Here are tips from two extraordinary reporters working in the Philippines: Rappler’s Patricia Evangelista and Reuters’ Clare Baldwin.

Data Journalism

GIJN’s Data Journalism Top 10: Data Feminism, Blockchain for Investigations, Train Speeds, EU DataViz Conference

What’s the global data journalism community tweeting about this week? Our NodeXL #ddj mapping from April 15 to 21 finds an informative interactive tool about the health of our generation by @srfdata, a piece by academic @wsaqaf explaining how journalism can utilize blockchain for investigations, data visualization teaching materials by @R_Graph_Gallery, and a book draft on data feminism by @kanarinka and @laurenfklein.

Data Journalism

GIJN’s Data Journalism Top 10: Populism Quiz, EU Fact-Checking, Twitter Data, GitHub 101

What’s the global data journalism community tweeting about this week? Our NodeXL #ddj mapping from March 18 to 24 finds a collection of beautiful news graphics by Megan Jaegerman curated by statistician @EdwardTufte, @tagesanzeiger’s quiz testing readers’ level of populist leanings, a new collaborative fact-checking effort by the name of @FactcheckEU, and @briromer’s interesting piece on maps that break strict geography rules.

Data Journalism

GIJN’s Data Journalism Top 10: New Tools for Chartmaking and Sonification, 3D Data, Hedgehog Maps, Editable Spreadsheet Images

What’s the global data journalism community tweeting about this week? Our NodeXL #ddj mapping from March 4 to 10 finds several interesting tools and feature releases: @FinancialTimes’ chartmaking tool, @datavized’s data sonification tool and a new feature on @Microsoft’s Excel app that converts printed tables into editable spreadsheets, as well as @alice_corona’s discussion of building 3D data experiences, and @alyssafowers coining the term “hedgehog maps.”

Data Journalism

GIJN’s Data Journalism Top 10: Visualizing the 2018 News Cycle, the History of Football and Sacked Coaches

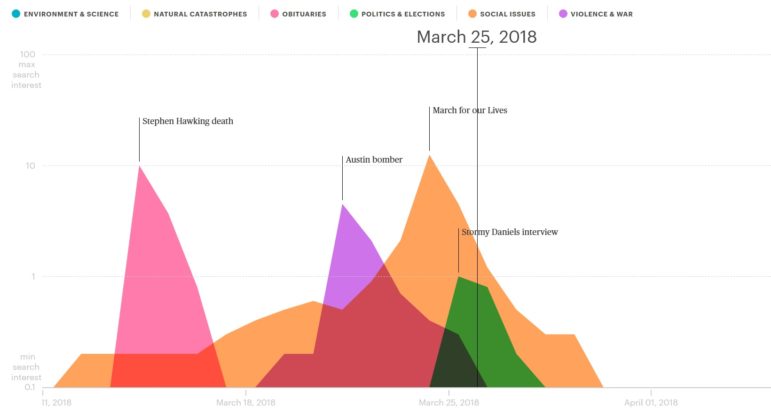
What’s the global data journalism community tweeting about this week? Our NodeXL #ddj mapping from January 21 to 27 finds @schemadesign and @GoogleTrends teaming up to visualize news cycles in 2018, the @washingtonpost’s flyover tour of the entire US-Mexico border and two interesting football-related visualizations: @ftblsm’s history of football and @NZZ’s analysis of whether football coaches Jose Mourinho and Julen Lopetegui should have been sacked.