Data Journalism News & Analysis
Data Journalism Top 10: Child Detentions at US Border, Slave Journeys, Aztec Iconography, Facebook’s ‘Broken Promises’
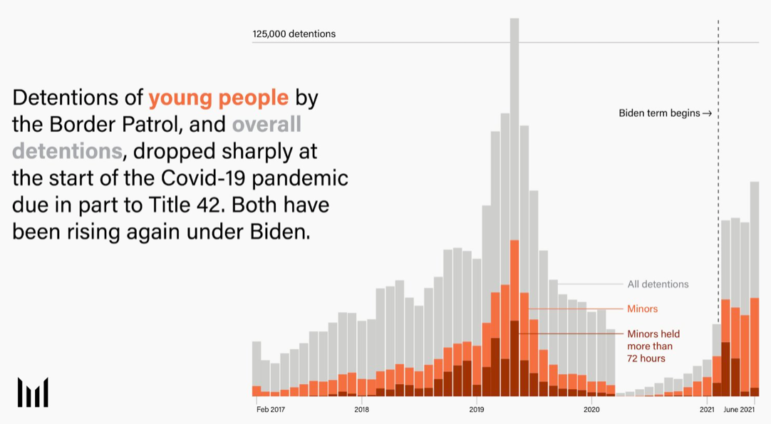
This week, our DDJ Top 10 looks at The Marshall Project’s analysis of child detention at the US border, the Baltimore Banner’s in-depth story on the city’s vacant housing crisis. Plus, we dive into stories using historical data to investigate how slavery broke apart families, a flight analysis on the new destinations of the Russian elite, and a look at Facebook’s “broken promises.”