
Reporting Tools & Tips
New AI and Large Language Model Tools for Journalists: What to Know
At the 2024 NICAR conference, data experts grappled with the broader question of when and how AI is appropriate to use in newsrooms.

At the 2024 NICAR conference, data experts grappled with the broader question of when and how AI is appropriate to use in newsrooms.
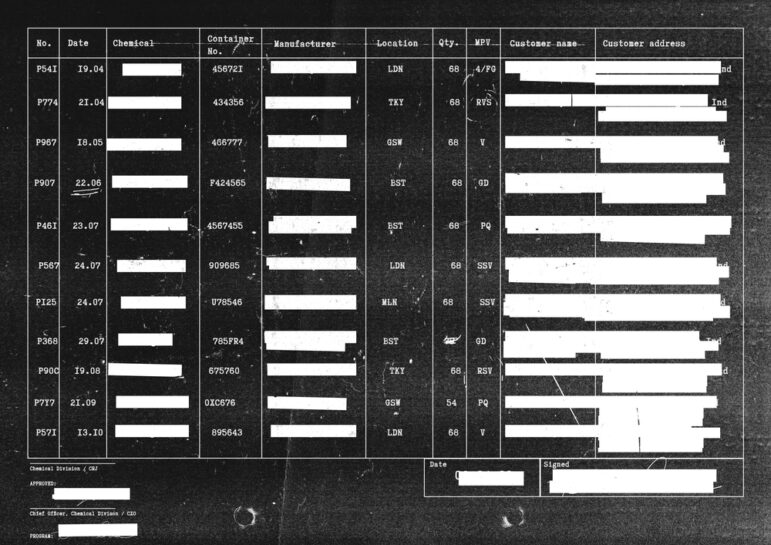
DocumentCloud now includes many more cutting-edge functions — which include extracting personal identification information embedded in large files, importing data from programs like Google Drive, transcribing YouTube audio, and even peering through weak blackout redactions.
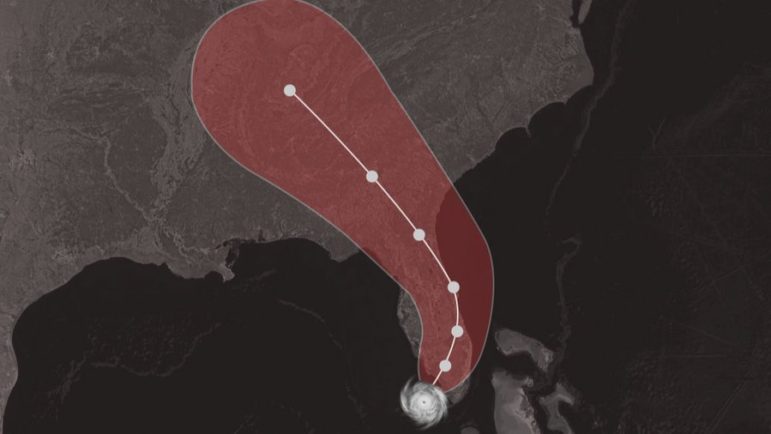
What’s the global data journalism community tweeting about this week? Our NodeXL #ddj mapping from August 26 to Sept 1 finds The New York Times examining the massive amount of digital trackers that follow an individual’s web activity, The Washington Post looking at the stress on global water resources, Data Visualization Society announcing the first #VizRisk challenge winners, and Datajournalism.com sharing tips on how journalists can learn to code.

With the global spread of data journalism, the advent of artificial intelligence and the increasing use of big data moving alongside a rapid rise of disinformation, GIJN asked data journalism experts around the world what they anticipate for 2019. Here are their thoughts on the major trends, ideas and technologies that will affect how we do our jobs.

Video games and journalism have had a history — the melding of the two has been less successful in breaking news because of the fast turnaround. However, it has seen more successes in longer investigations that take more time to develop. ProPublica’s Sisi Wei shares the process behind the unit’s gamification of five asylum seekers’ stories.

If you didn’t make it to Seoul for this year’s Uncovering Asia conference — or couldn’t be at two panels at the same time — never fear, tipsheets from our impressive speakers are here! But just in case you can’t decide where to start, here are five presentations that are definitely worth checking out.
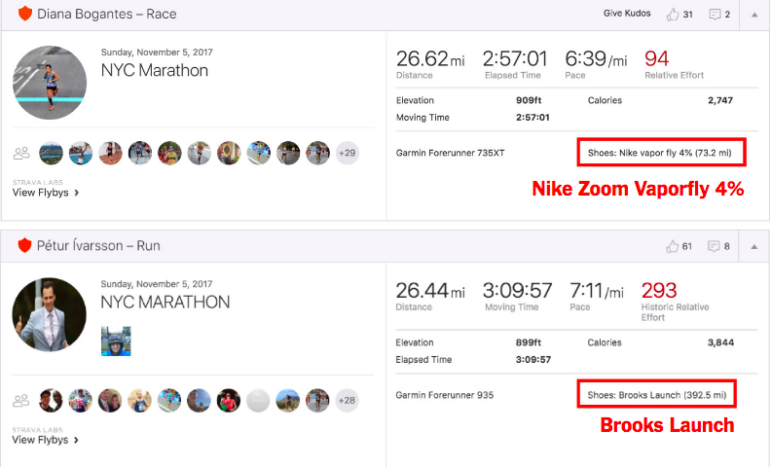
What’s the global data journalism community tweeting about this week? Our NodeXL #ddj mapping from July 16 to 22 finds @UpshotNYT confirming Nike’s claim that their Vaporflys really do give runners an advantage, @FinancialTimes visualizes Trump’s escalating trade war, Britain’s digital divide and introduces their new charting tool and @MilesMcBain makes some data journalists very happy by creating Datapasta.
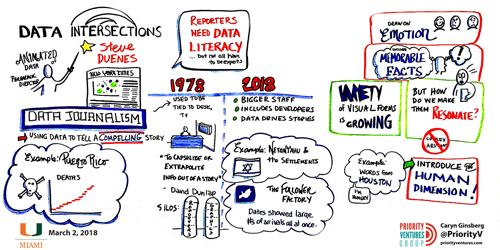
What’s the global data journalism community tweeting about this week? Our NodeXL #ddj mapping from March 19 to 25 finds a sobering study on income inequality between black and white males visualized by @nytimes, a cool time-lapse graphic of snow fall in the United States by @PostGraphics and peak baby-making seasons by country by @VismeApp and @ddjournalism.

What’s the global data journalism community tweeting about this week? Our NodeXL #ddj mapping from Sept 4 to 10 has @FastCoDesign bringing the #EndtheRainbow argument to the fore, @puddingviz analyzing driving times to abortion clinics in the US and @nsuwatch dissecting a trial involving a German terrorist organization by the numbers.

Collaboration with newsroom developers and journalists is key to improving journalism. Hackastory spoke to 19 newsroom developers and journalists around the world for their best advice. Here are their top tips.