Accessibility Settings

color options

monochrome muted color dark

reading tools

isolation ruler

Tag

borders

3 posts

Data Journalism

Data Journalism Top 10: Connecting China’s Power Players, Tracking Russian Voter Turnout, Drawing the India-Pakistan Border, and Serena Williams’ Trailblazing Career

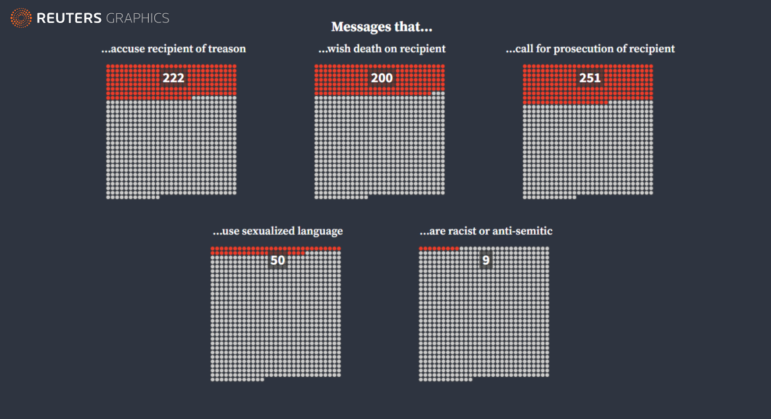
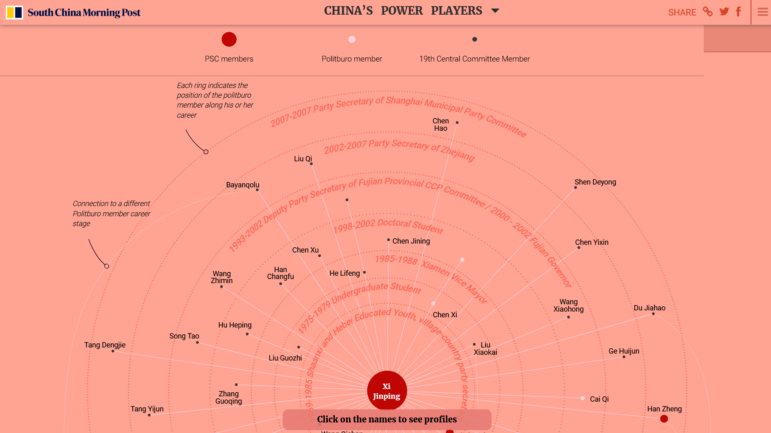
The workings of the Chinese Communist Party are shrouded in secrecy, but ahead of the party congress later this year The South China Morning Post published a detailed guide on the key power players. Also this week, an investigation into the arbitrary nature of military justice in the United States, an analysis of Russia’s election voter turnout using artificial intelligence, and charts celebrating Serena Williams’ tennis career.

Data Journalism

Data Journalism Top 10: Where Raindrops Go, Spiral Chart Debate, Prenatal Tests, Death Threat Dataviz

We have rolled into the third calendar year of the pandemic, but the debate about how journalists present data on the coronavirus continues to rage. Just six days into 2022, a spiral chart divided the data journalism community into two camps. Our weekly NodeXL analysis and curation of the most popular data journalism stories on Twitter also features an investigation into the prenatal testing industry, a visualization of death threats received by election staff, and an interactive map of Russian military bases near the Ukraine border.