
Image: Screenshot, Reuters
Iran’s Internet Blackouts, TikTok Health Misinformation, Visualizing Venezuela’s Oil, and a Fatal Shooting by ICE
Introduction to Investigative Journalism: Data Journalism

Data Cleaning Tools and Techniques for Non-Coders
How a Le Monde Team Uncovered 300 Contaminants in France’s Groundwater
Looking Back on Five Years: How the Sigma Awards Have Rallied and Inspired Data Journalism Excellence
Just over two weeks into 2026, and the year has already delivered an extraordinary catalog of geopolitical upheaval, giving data newsrooms plenty to dig into. The shocking capture of Venezuelan President Nicolas Maduro by US forces has dominated global headlines, sparking widespread analysis of its implications for oil markets, geopolitical norms, and whether this signals a new era of unpredictable foreign engagements. Our roundup features an El País piece examining the current shape of Venezuela’s oil industry. Beyond Venezuela, mass protests and brutal crackdowns in Iran have triggered internet blackouts, which the Financial Times explores. This edition of our Top 10 in Data Journalism, considering stories from the start of the year up to January 14, also highlights a mapping project by the Guardian explaining how wildfires are now destroying twice as much forest as two decades ago, a video analysis of the fatal shooting of a woman by an ICE agent in the US, and a Público analysis of TikTok videos uncovering the prevalence of false health claims often linked to natural foods.
Iran’s Internet Shutdown
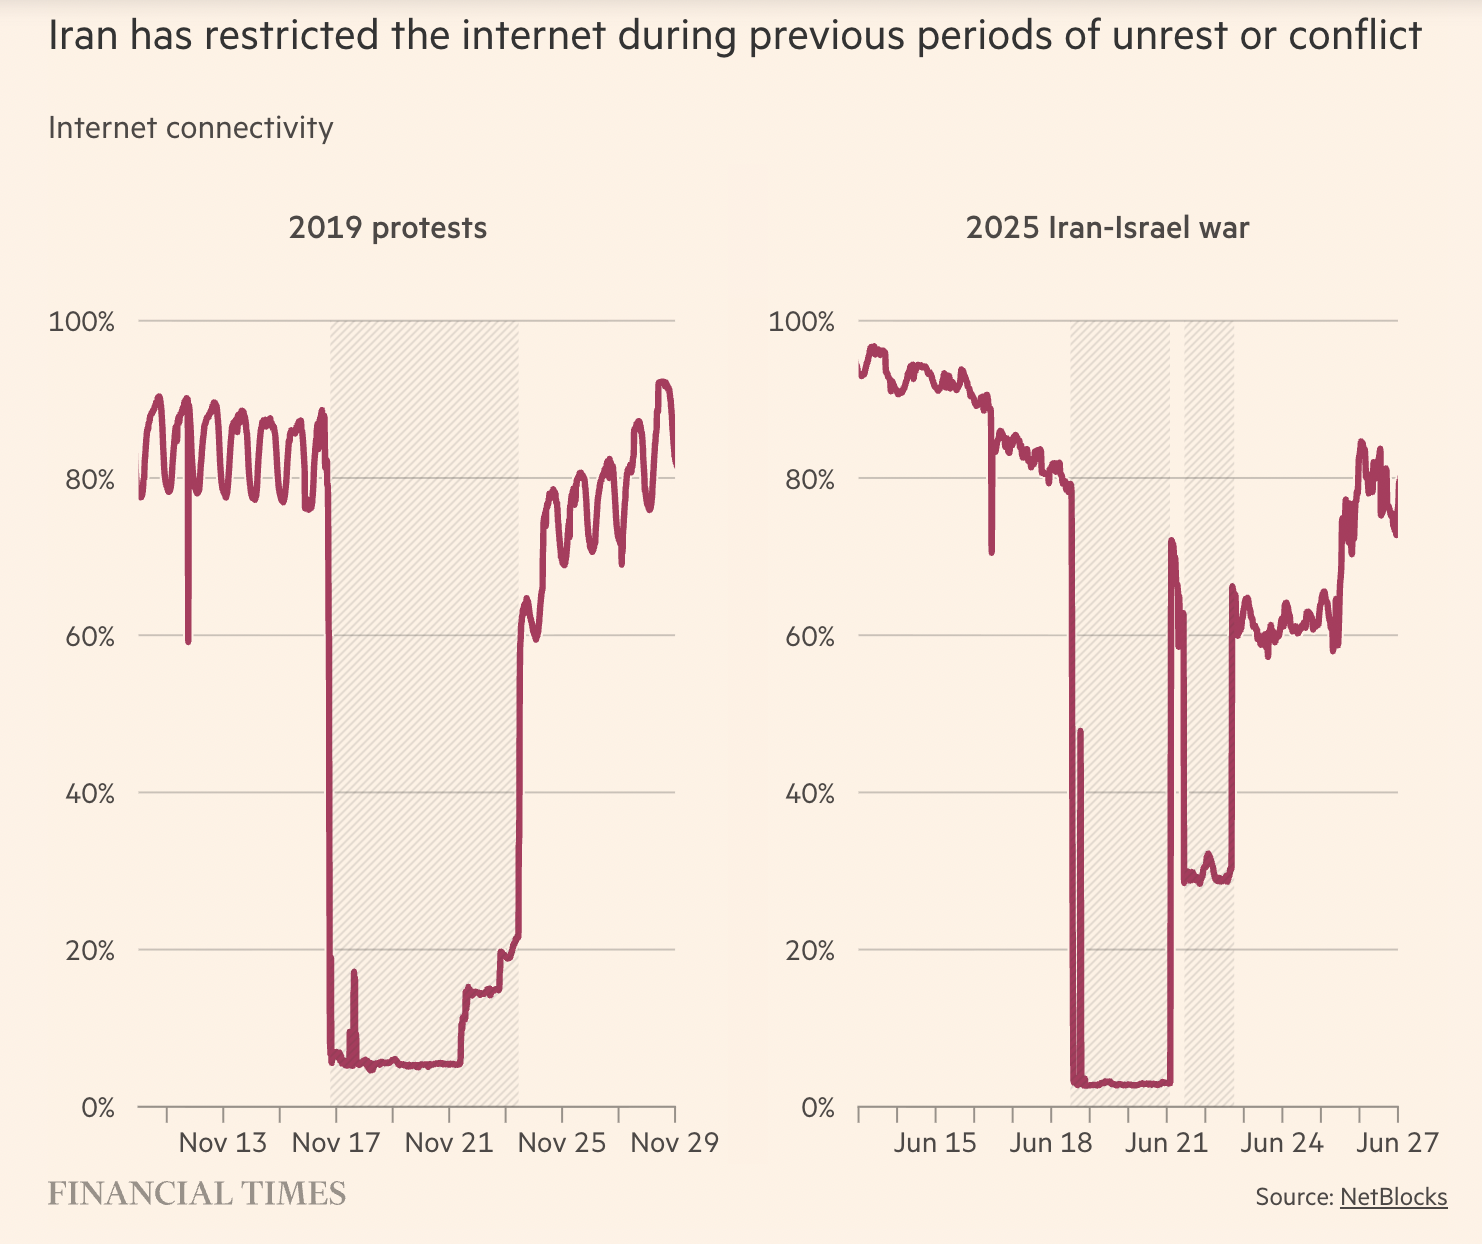
Image: Screenshot, FT
As nationwide protests over economic hardship and political repression swept through Iran at the beginning of this year, the government imposed one of the most complete internet shutdowns in recent memory, cutting off users from the global web while selectively restoring a pared-down domestic network. The near-total blackout has silenced many online channels and hampered the flow of information about the unrest. The Financial Times used two key charts to document the digital shutdown — one visualizing the recent connectivity collapse using NetBlocks data and a second chart comparing internet blackouts during the 2025 Iran-Israel war and 2019 protests, when Iran’s walled-off National Information Network (NIN) proved insufficient to contain protest communication. FT’s analysis underscores how Tehran’s decades‑long investment in a parallel internet has repeatedly failed to contain dissent, and how activists and exiles have kept some information flowing via Starlink satellite connections, creating a small, resilient network that allows videos and news of the protests to reach the outside world.
Visualizing Venezuela’s Oil
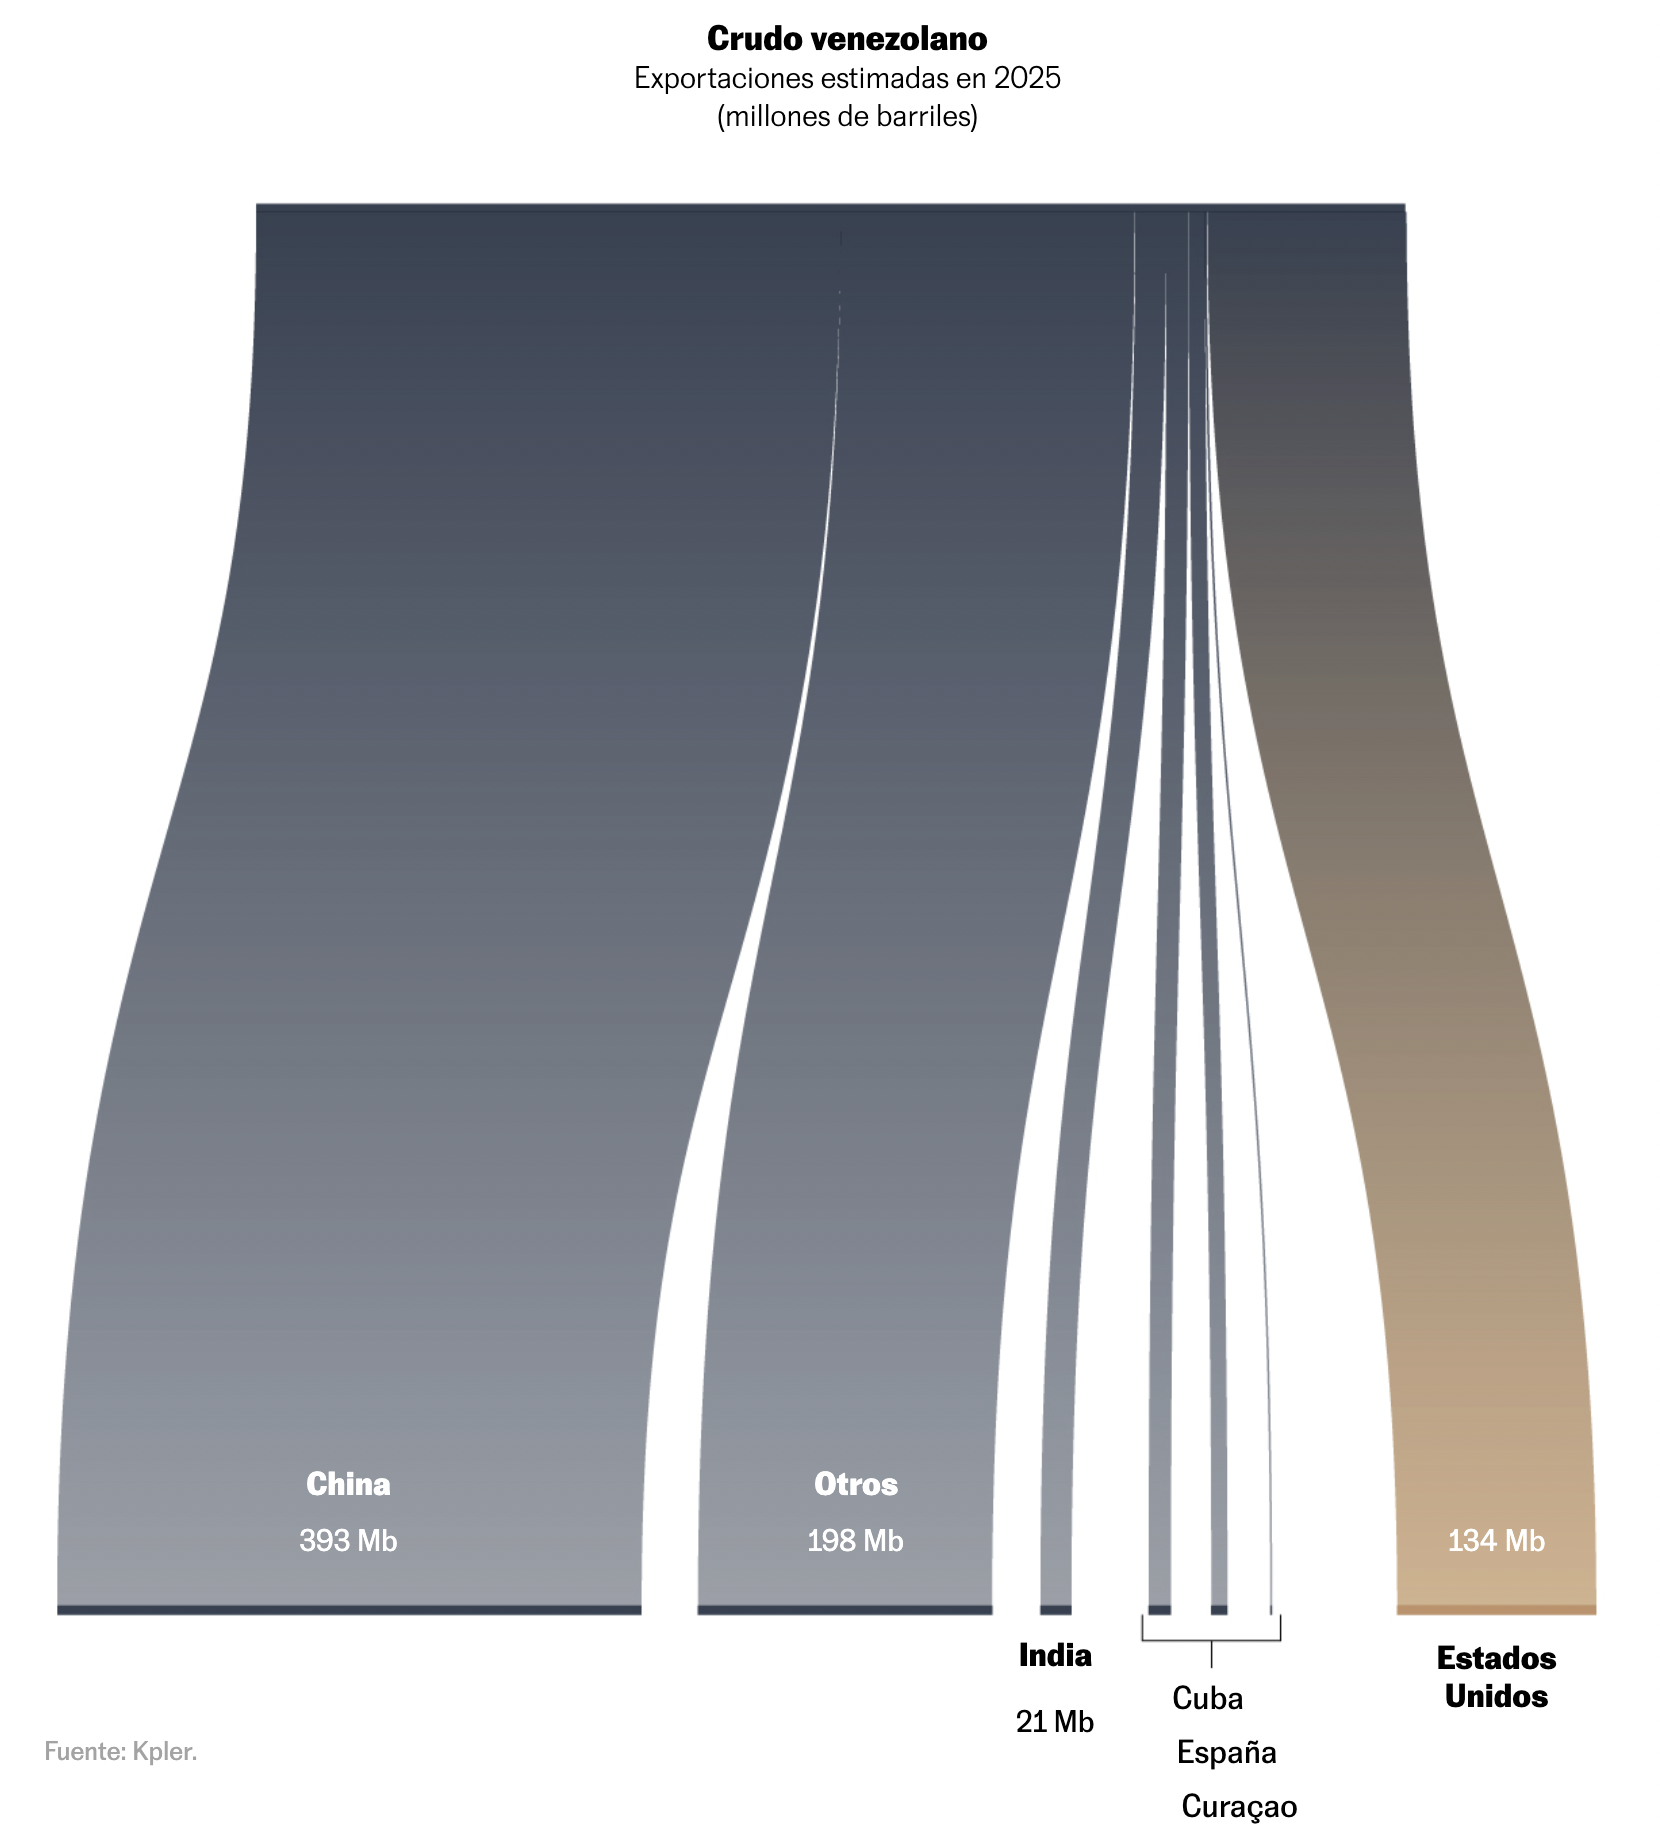
Image: Screenshot, El País
After US forces attacked Venezuela and captured President Nicolas Maduro at the start of the year, President Donald Trump declared that US oil companies would spend billions to rebuild Venezuela’s energy sector. Once a top global oil exporter, Venezuela now produces only a small fraction of the world’s crude despite holding the largest known reserves on the planet. Drawing on data from Global Energy Monitor, Our World In Data, PDVSA — Venezuela’s state-owned oil and gas company — and data analytics firm Kpler, the newspaper El País visualized the paradox of the oil industry. Using circle charts, it contrasted global oil reserves from 1980 and 2020 across major oil-producing countries, while its line charts traced diverging trajectories of reserves and production. Despite its immense reserves, Venezuela’s output has collapsed to under one million barrels per day. Visualized in a Sankey diagram, the data also showed how Venezuela now sends most of its crude to China, often via “ghost tankers” that switch off tracking to evade sanctions.
Rampant Health Misinformation on TikTok
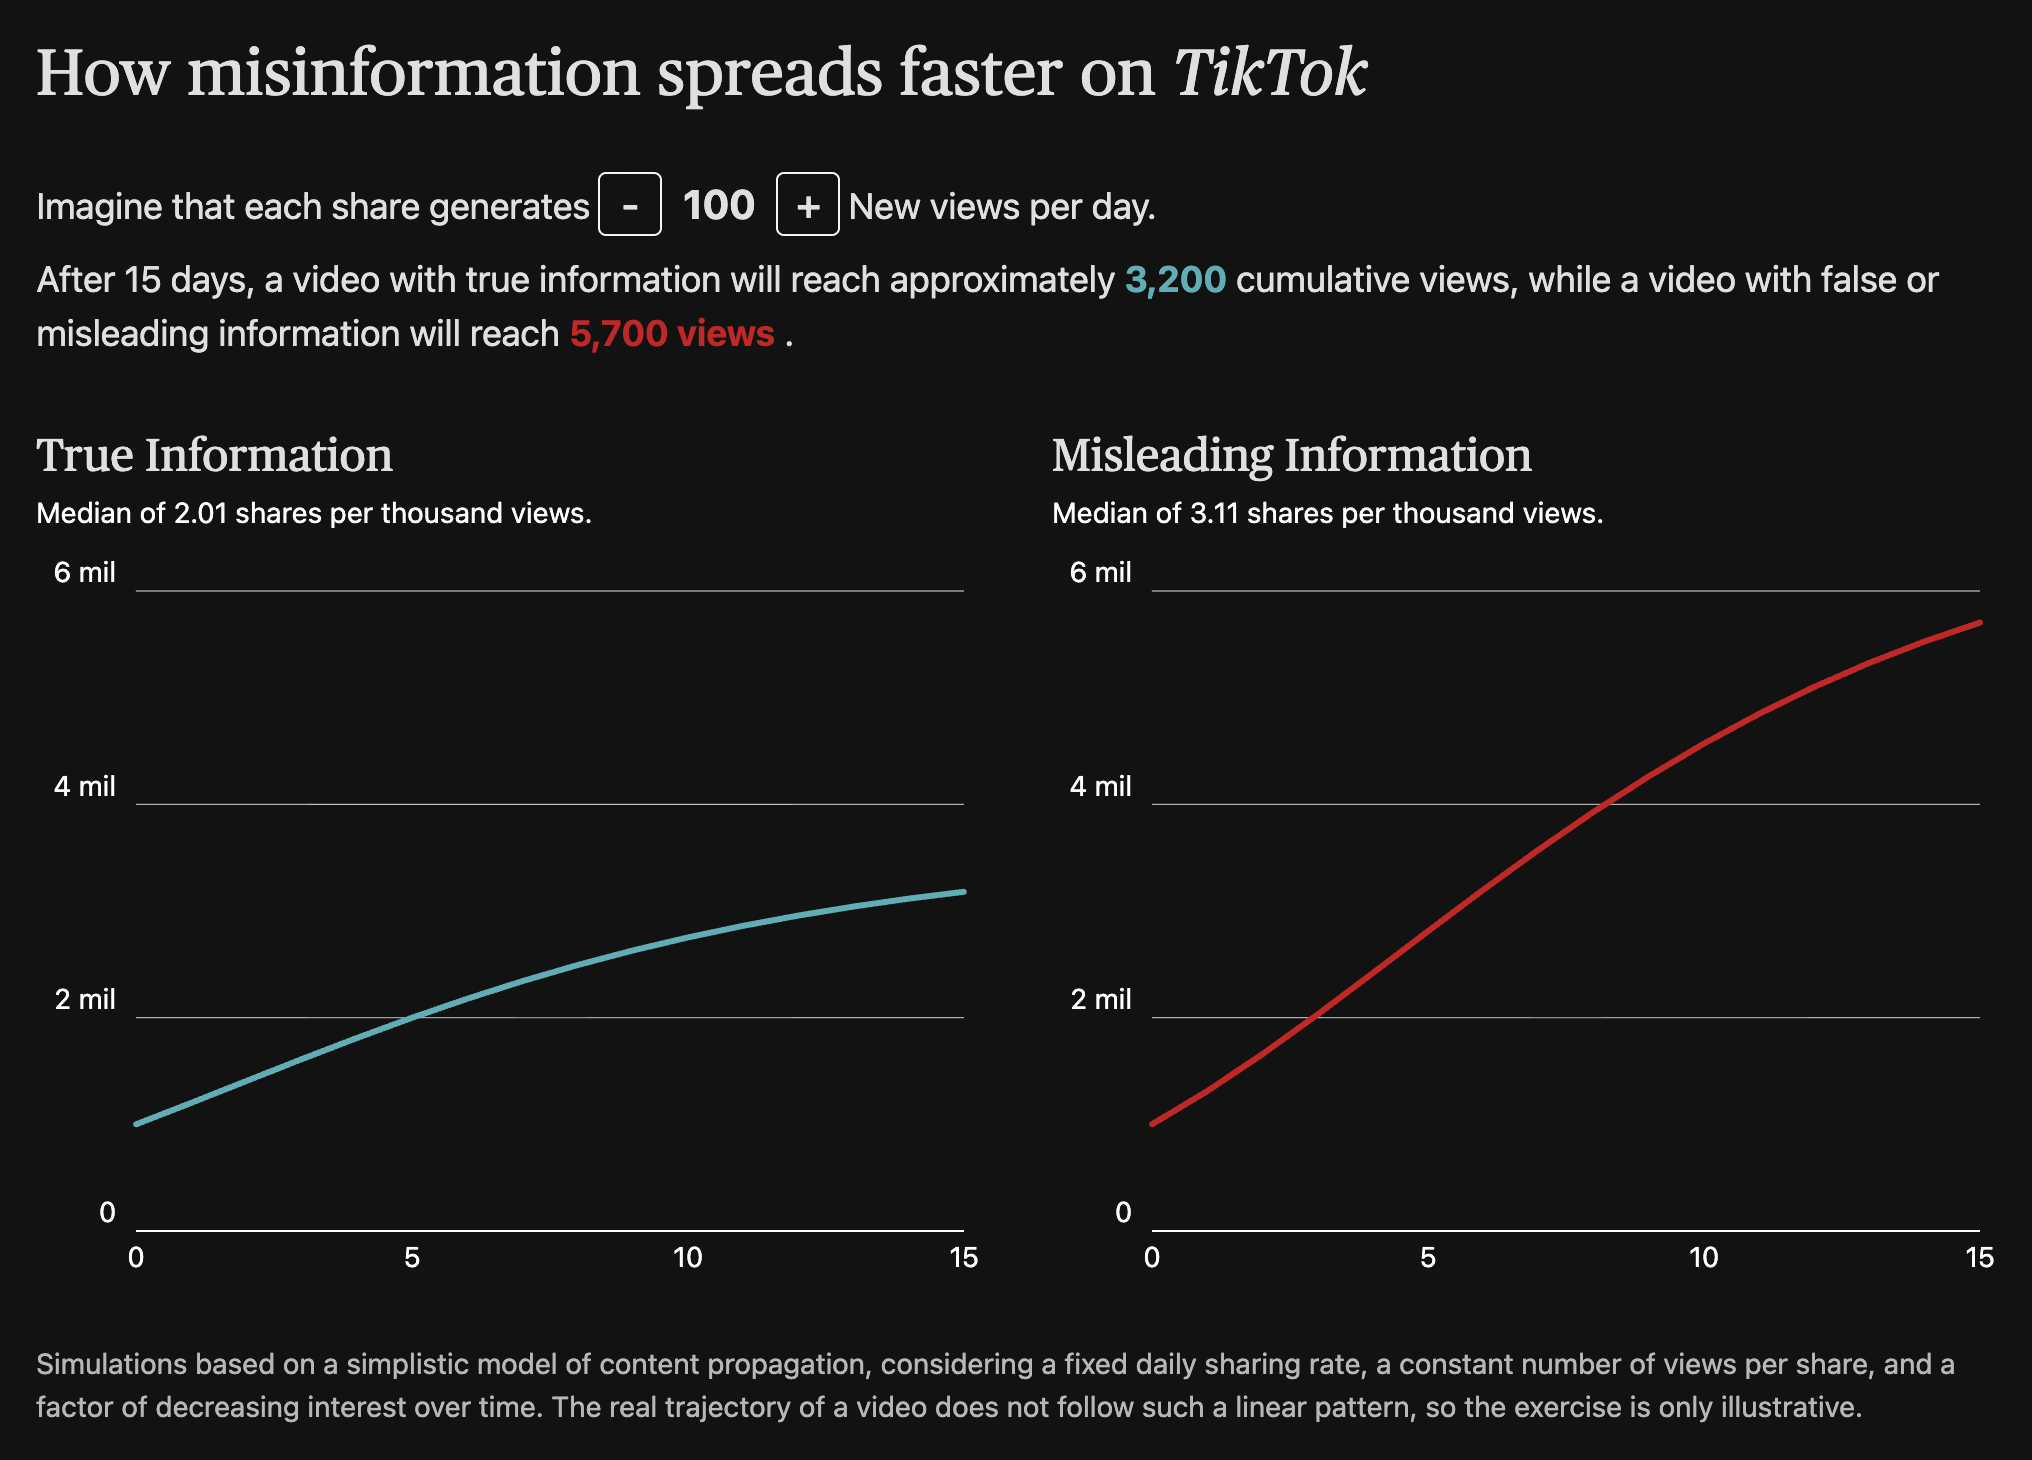
Image: Screenshot, Público
In an age where social media is a go-to source for many when seeking health advice, users are often drawn to short videos promising quick, natural remedies. Portuguese outlet Público analyzed over 7,000 health-related claims across 1,860 TikTok videos, uncovering widespread misinformation on the platform. The team isolated health-related hashtags and used an AI model to determine if the associated videos contained any verifiable claims. A central AI system sorted each health claim and sent it to one of five specialized AI assistants, each focused on a specific topic, such as medicine, nutrition, and reproductive health. Following strict rules, the AI assistants checked whether the claim was true, misleading, or false, with journalists manually reviewing the verdicts. The story then plotted and ranked hashtags by the percentage of videos containing at least one false or misleading claim, highlighting that misinformation outpaced accurate content. A network-style map recreated TikTok’s content “universe,” clustering videos into six major narratives. The analysis showed that TikTok’s appeal to natural remedies is paired with both confirmation and authority biases, creating a self-reinforcing cycle of misinformation.
Inside Singapore’s Traffic Noise Problem
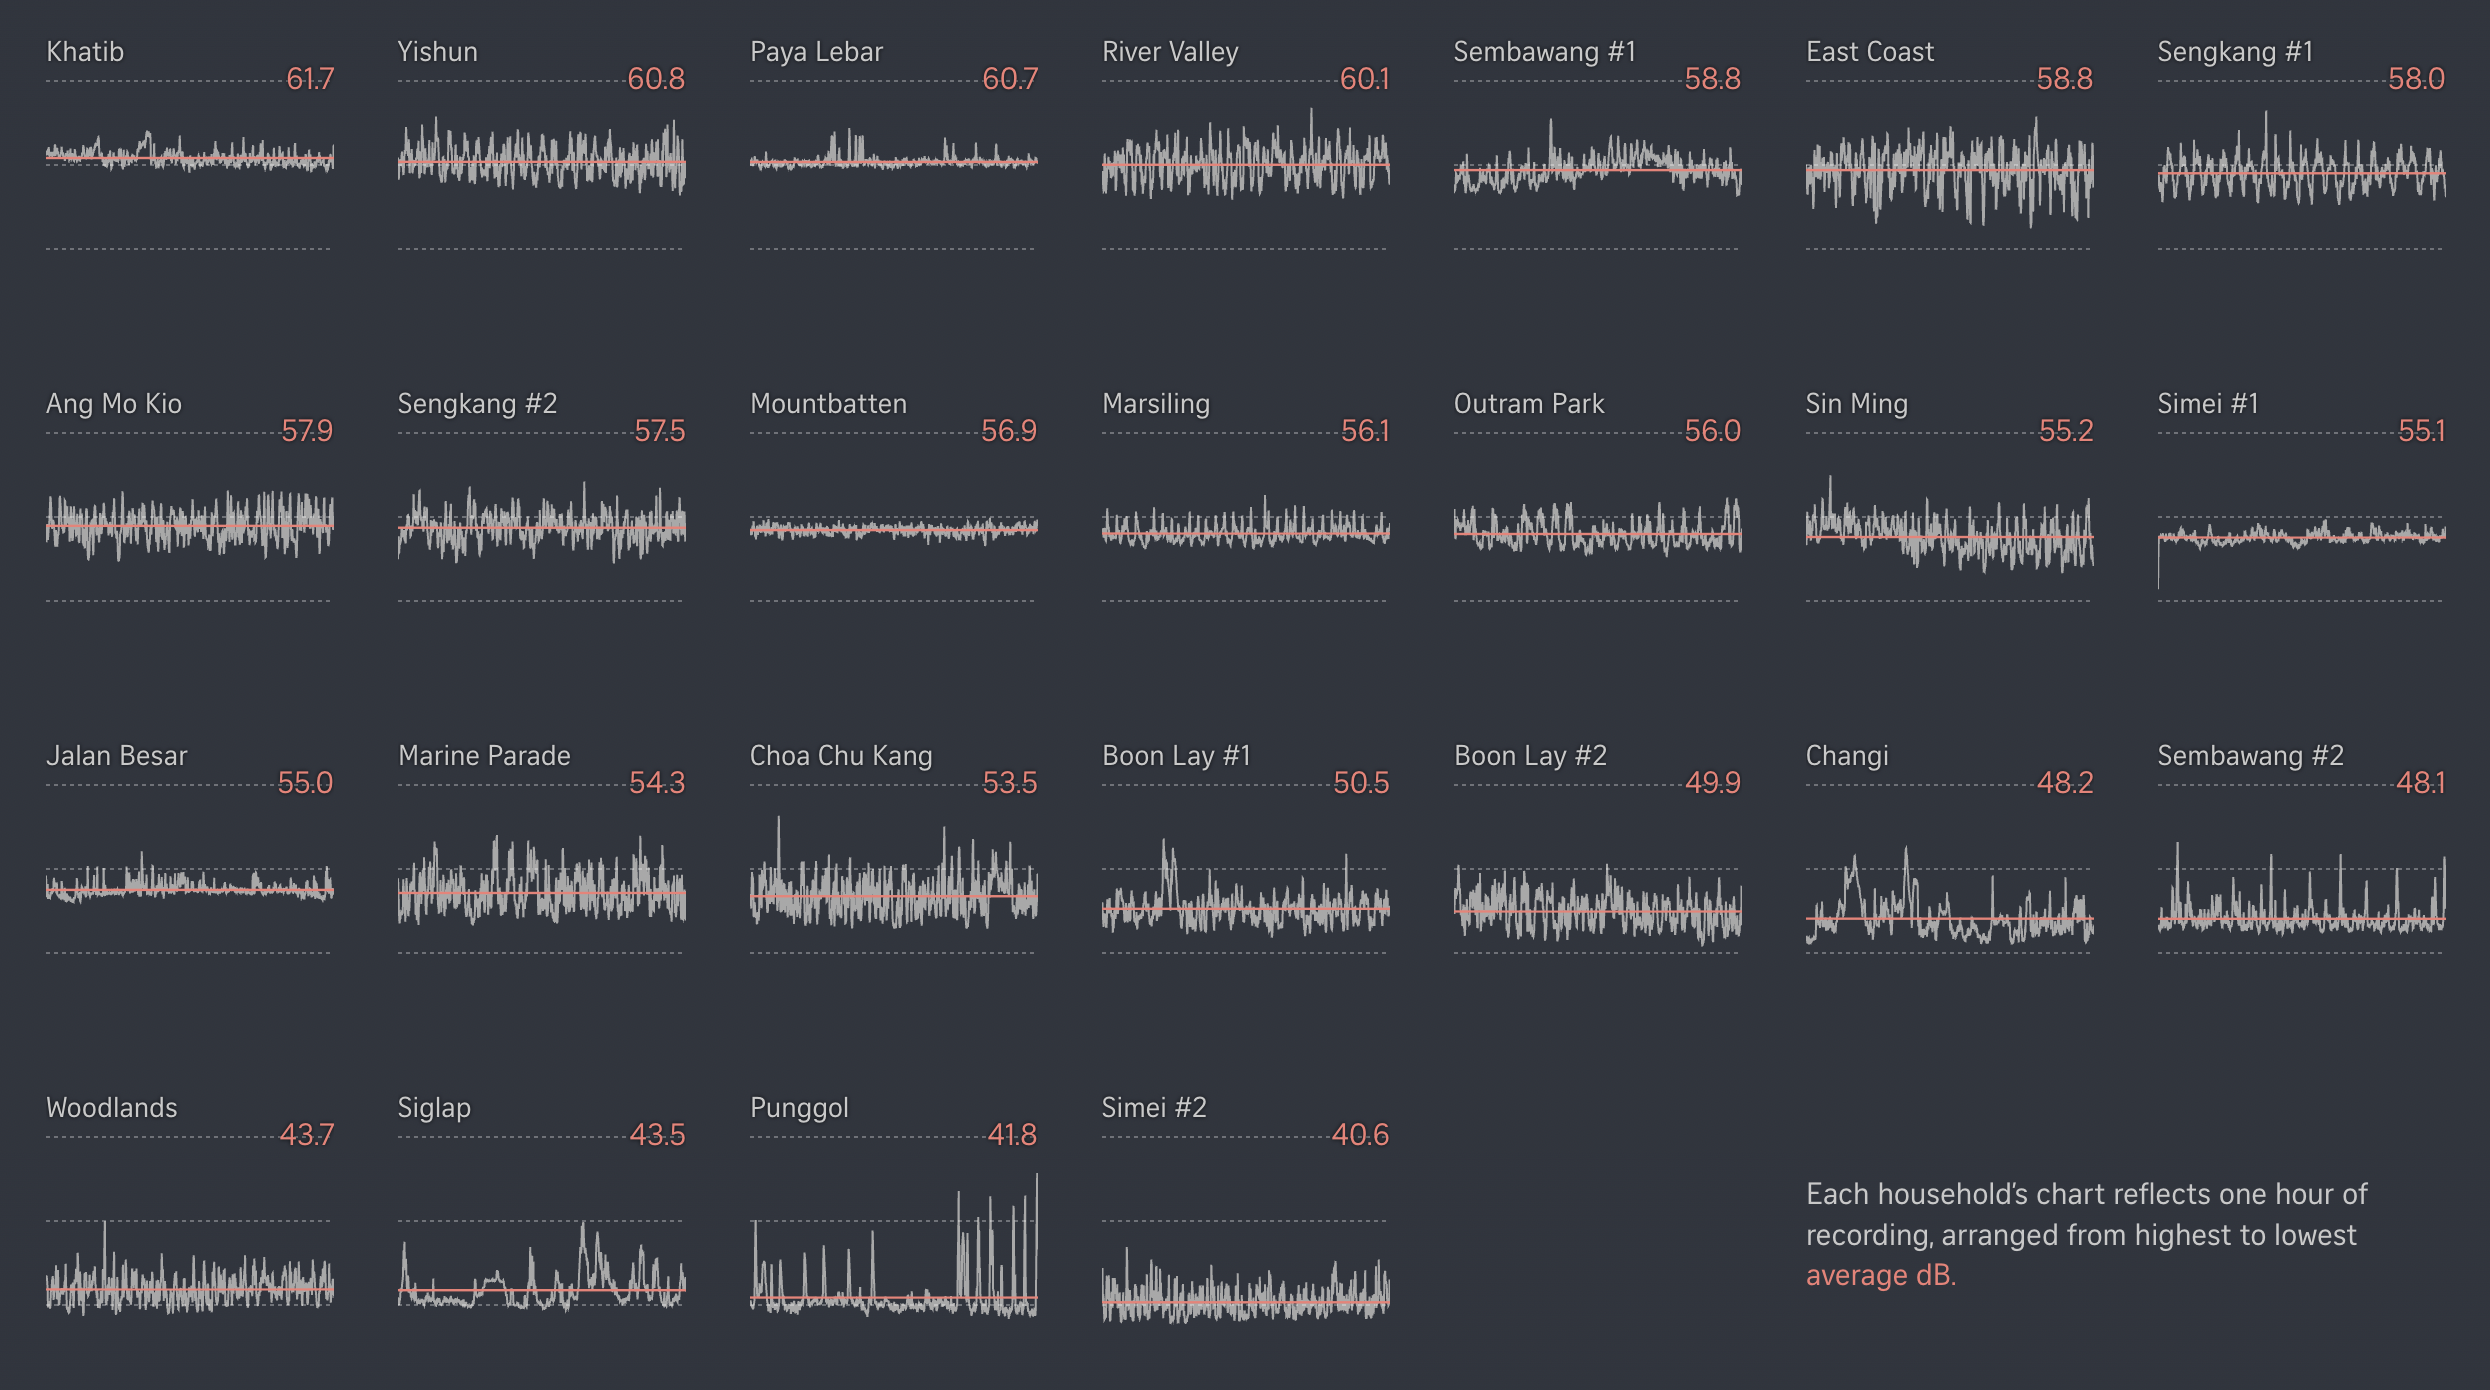
Image: Screenshot, Straits Times
Singapore is a global hub, where dense transport networks keep the city moving, and constant traffic noise is an inescapable part of daily life. The World Health Organization (WHO) warns that sustained noise above 53 decibels (dB) can harm health, and identifies road traffic noise as the second most damaging environmental stressor after air pollution, while Singapore’s National Environment Agency recommends that indoor levels stay below 57dB. To examine how closely residents live to these thresholds, The Straits Times measured noise inside 25 homes near major roads, MRT lines, and flight paths. Using high-quality sound equipment, the team recorded over 100 hours of audio divided into one-hour segments and plotted on decibel level graphs to illustrate the average hourly levels. The team also isolated louder sound events and analyzed their psychoacoustic features, such as sharpness and roughness, revealing why certain noises feel more intrusive, such as the screech of brakes.
The World Is Losing Its Forests to Fire
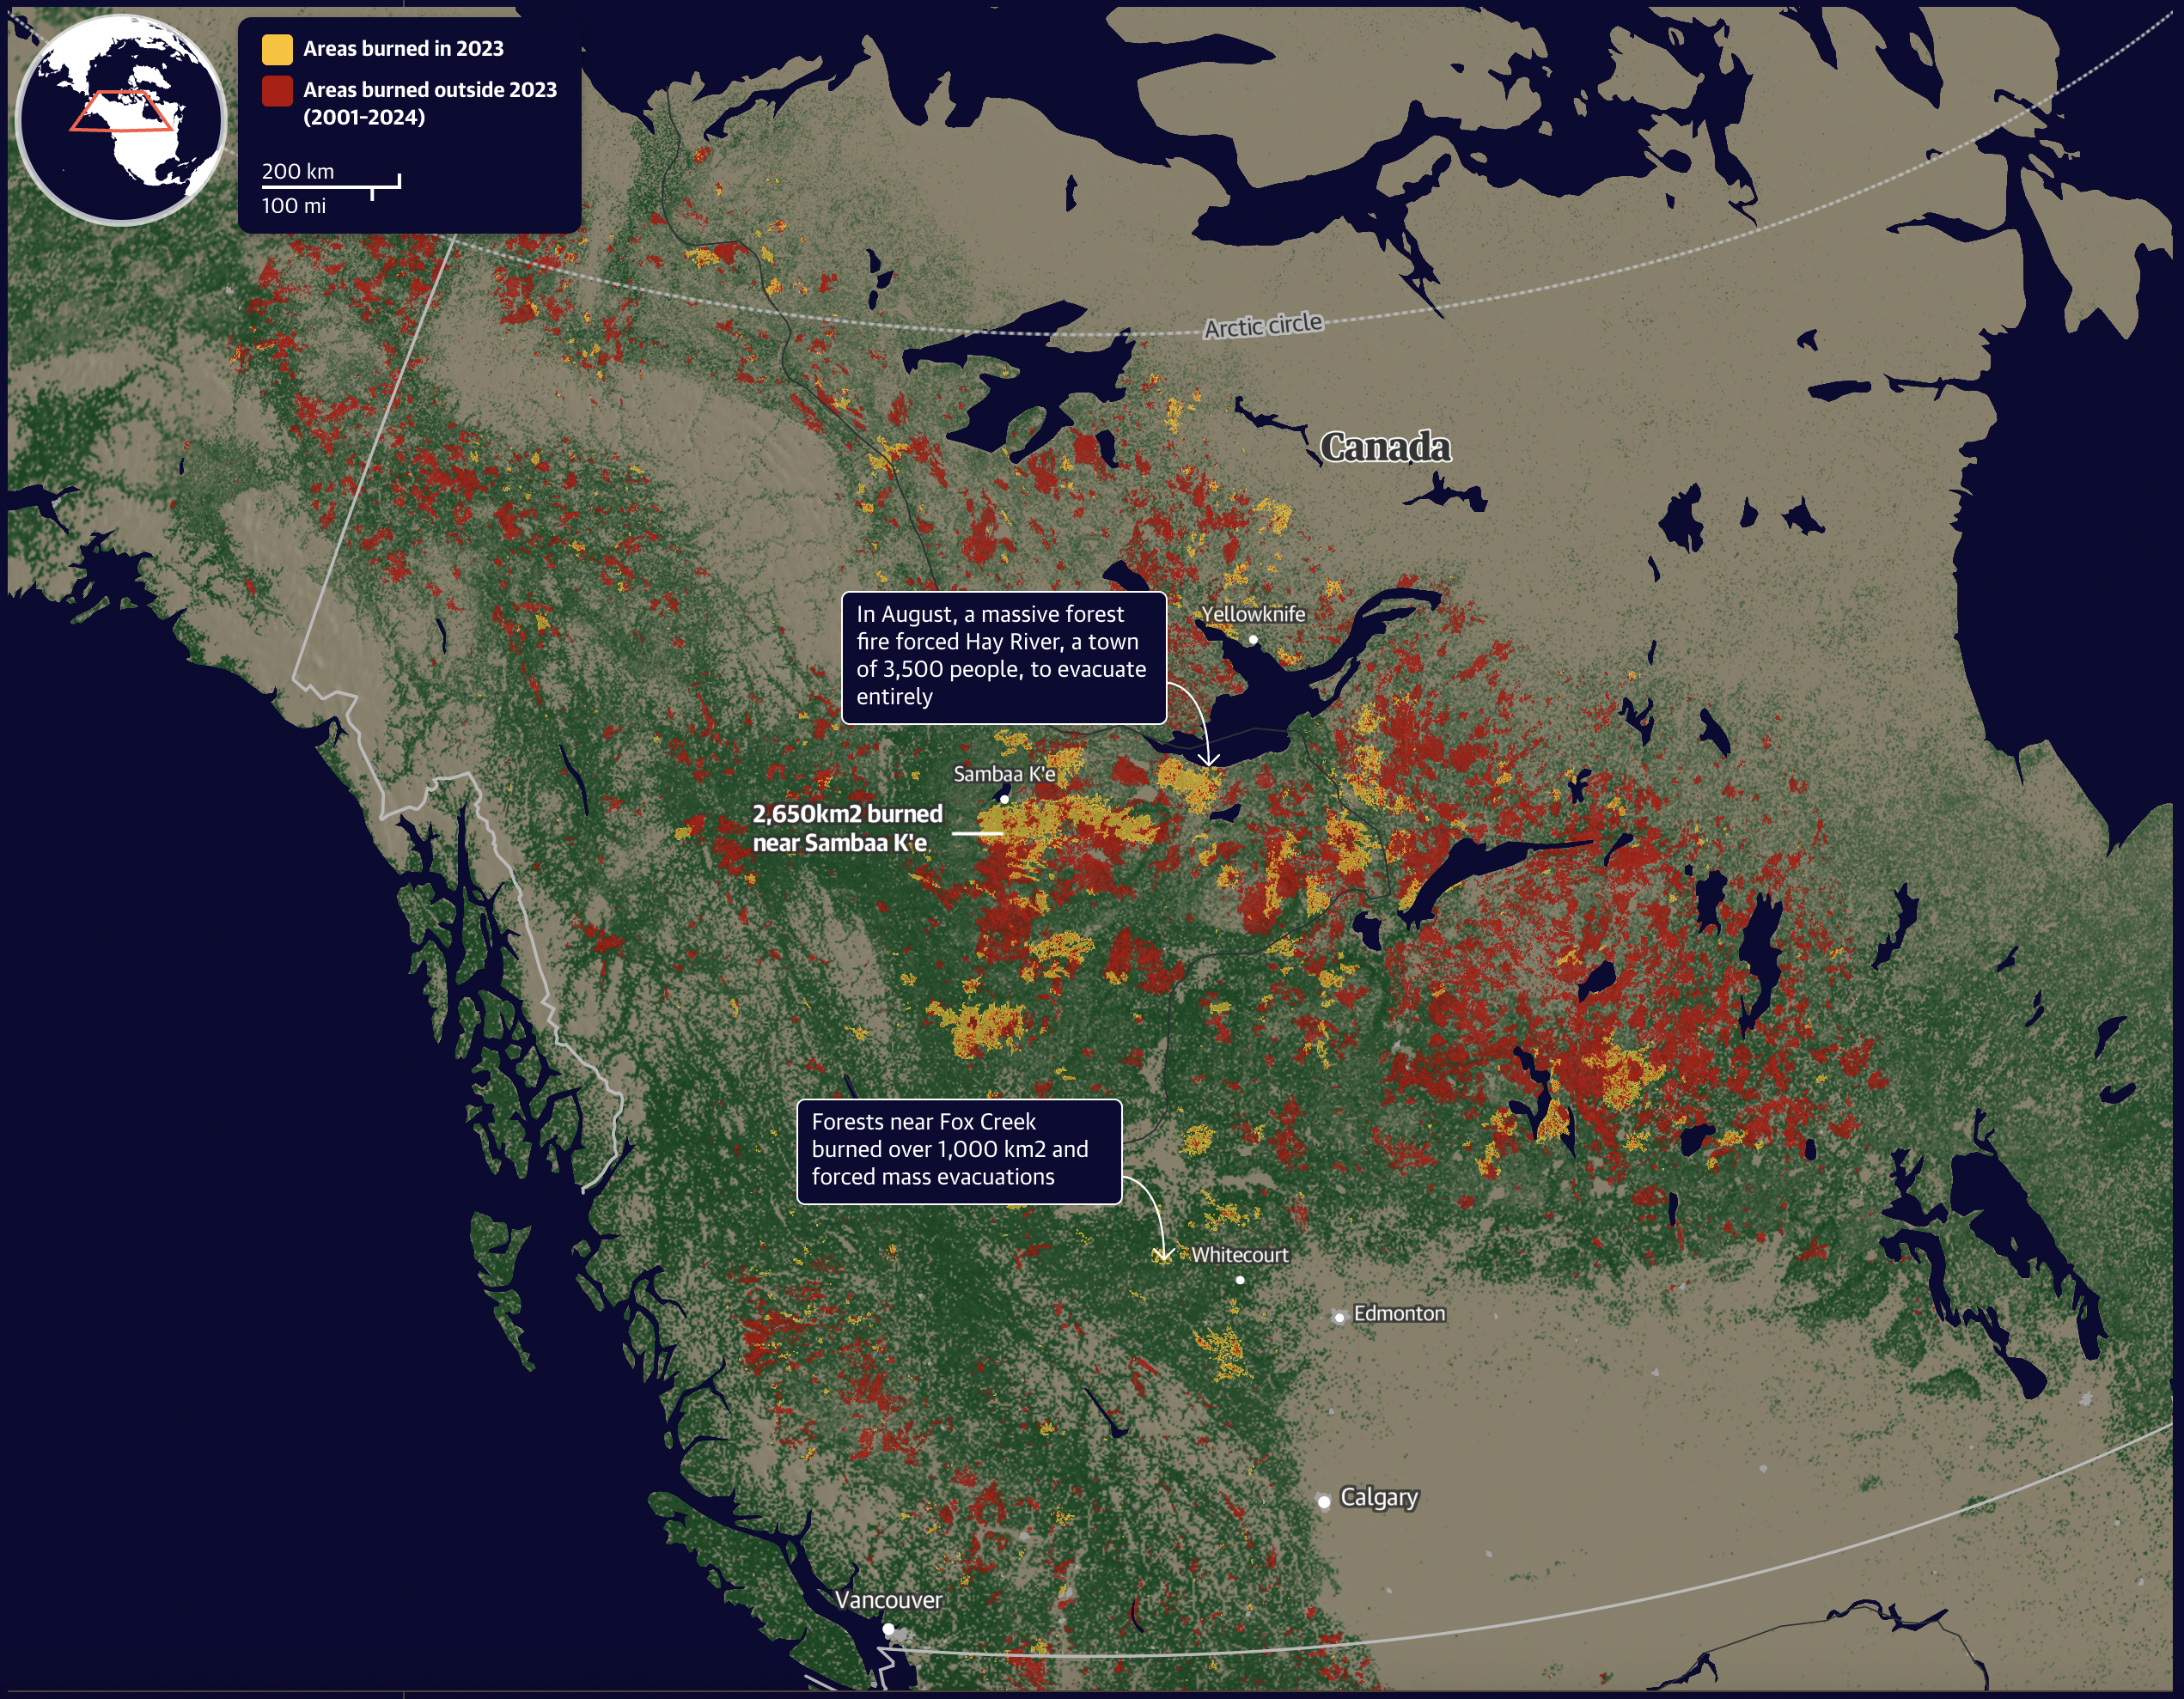
Image: Screenshot, The Guardian
The Guardian mapped the increasing number of wildfires across the globe, showing that every day in 2024, fires consumed an area larger than Malta (120-plus square miles). Using data from the University of Maryland on global forest loss due to fire, the maps compared areas burned in 2024 with losses in the period between 2001 and 2024, highlighting some of the most affected forests. Research from the World Resources Institute showed that 2024 was the first time major fires swept across tropical, hot, and humid forests such as the Amazon, as well as boreal forests in Canada. The analysis focused on five regions: Brazil, Bolivia, Russia, Australia, and Canada, all of which have endured some of their worst fire seasons in decades as heatwaves driven by climate change fuel larger, longer, and more destructive blazes. Normally acting as carbon sinks, forests absorb carbon dioxide and regulate the climate, but in 2023 and 2024, they captured only a quarter of their typical annual intake, releasing vast amounts of stored carbon into the atmosphere, raising the stakes for climate stability.
Tracking Threats from SpaceX Debris
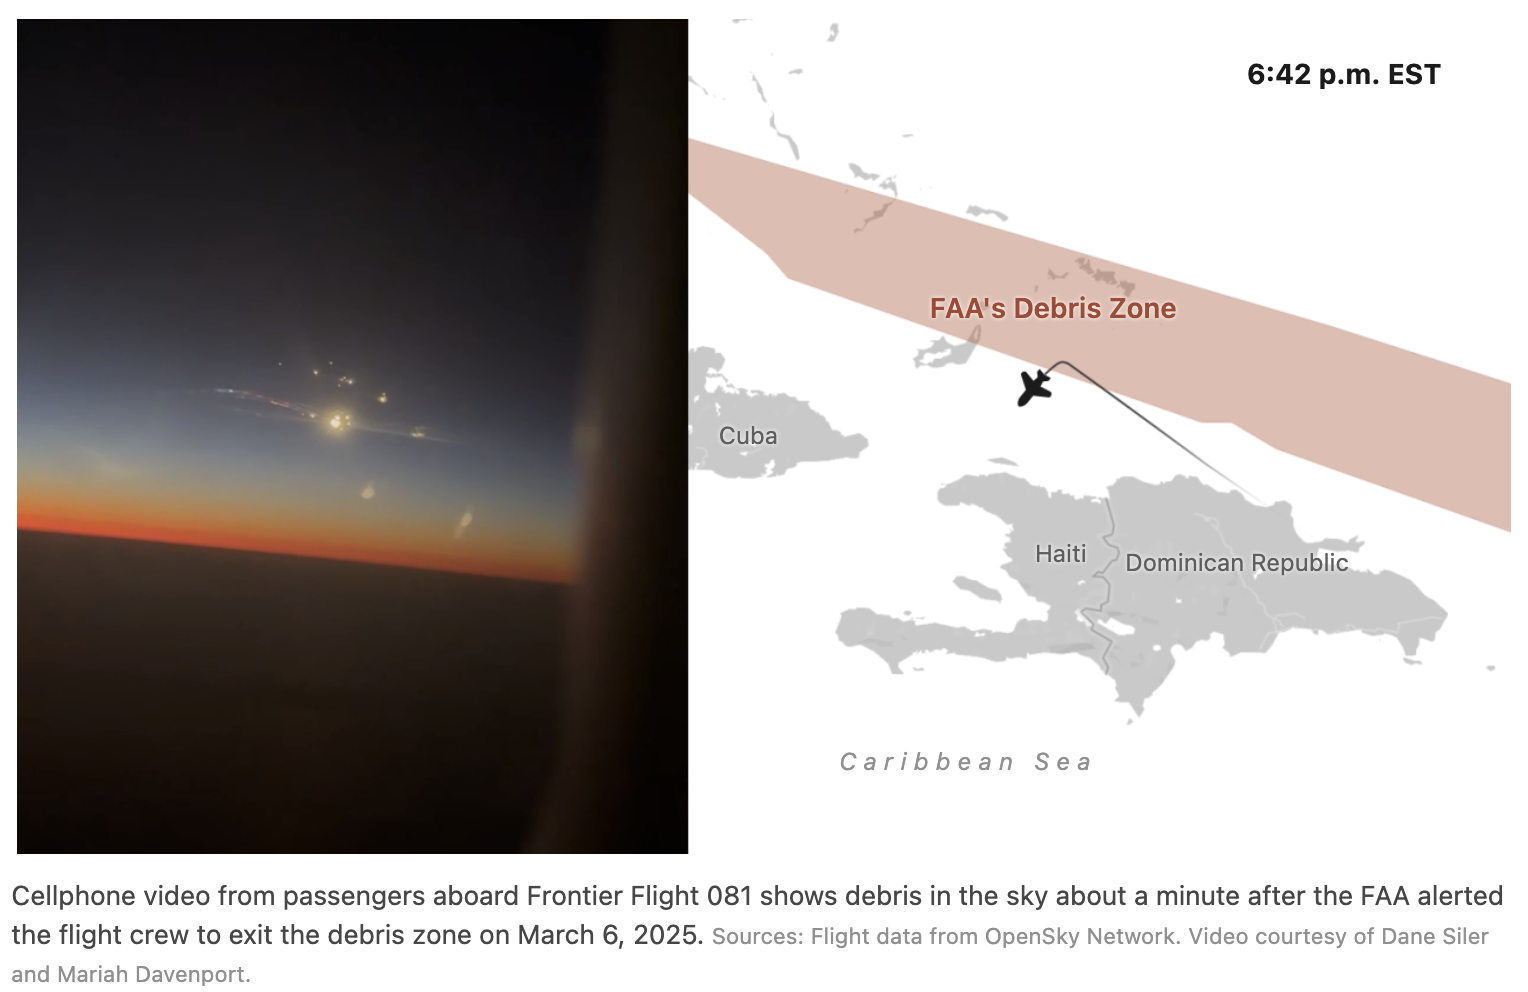
Image: Screenshot, ProPublica
When a SpaceX Starship test flight exploded over the Caribbean in January 2025, it had potentially serious consequences for commercial flights. Delta Flight 737, en route from San Juan, Puerto Rico to Atlanta, was forced into a sharp diversion after air traffic controllers warned of falling debris and the Federal Aviation Administration (FAA) cleared a large section of busy airspace. In a visual investigation, ProPublica reconstructed how commercial flights were pulled into SpaceX’s testing orbit. Using flight-tracking data from OpenSky and ADS-B Exchange, reporters mapped aircraft paths against the FAA’s debris zone, tracing how planes were forced to abruptly alter course in the minutes after the explosions. The analysis identified another 20 flights making sudden turns, while dozens more were rerouted during the 86-minute airspace closure. The maps were supplemented with photos of recovered rocket fragments, passenger videos, agency documents, interviews with pilots and passengers, and air traffic control recordings to show how experimental launches repeatedly push risk into civilian airspace, and how little margin for error exists when debris weighing just 300 grams (around 10 ounces) can represent a severe threat to an aircraft mid-flight.
ICE Killing of Renee Good
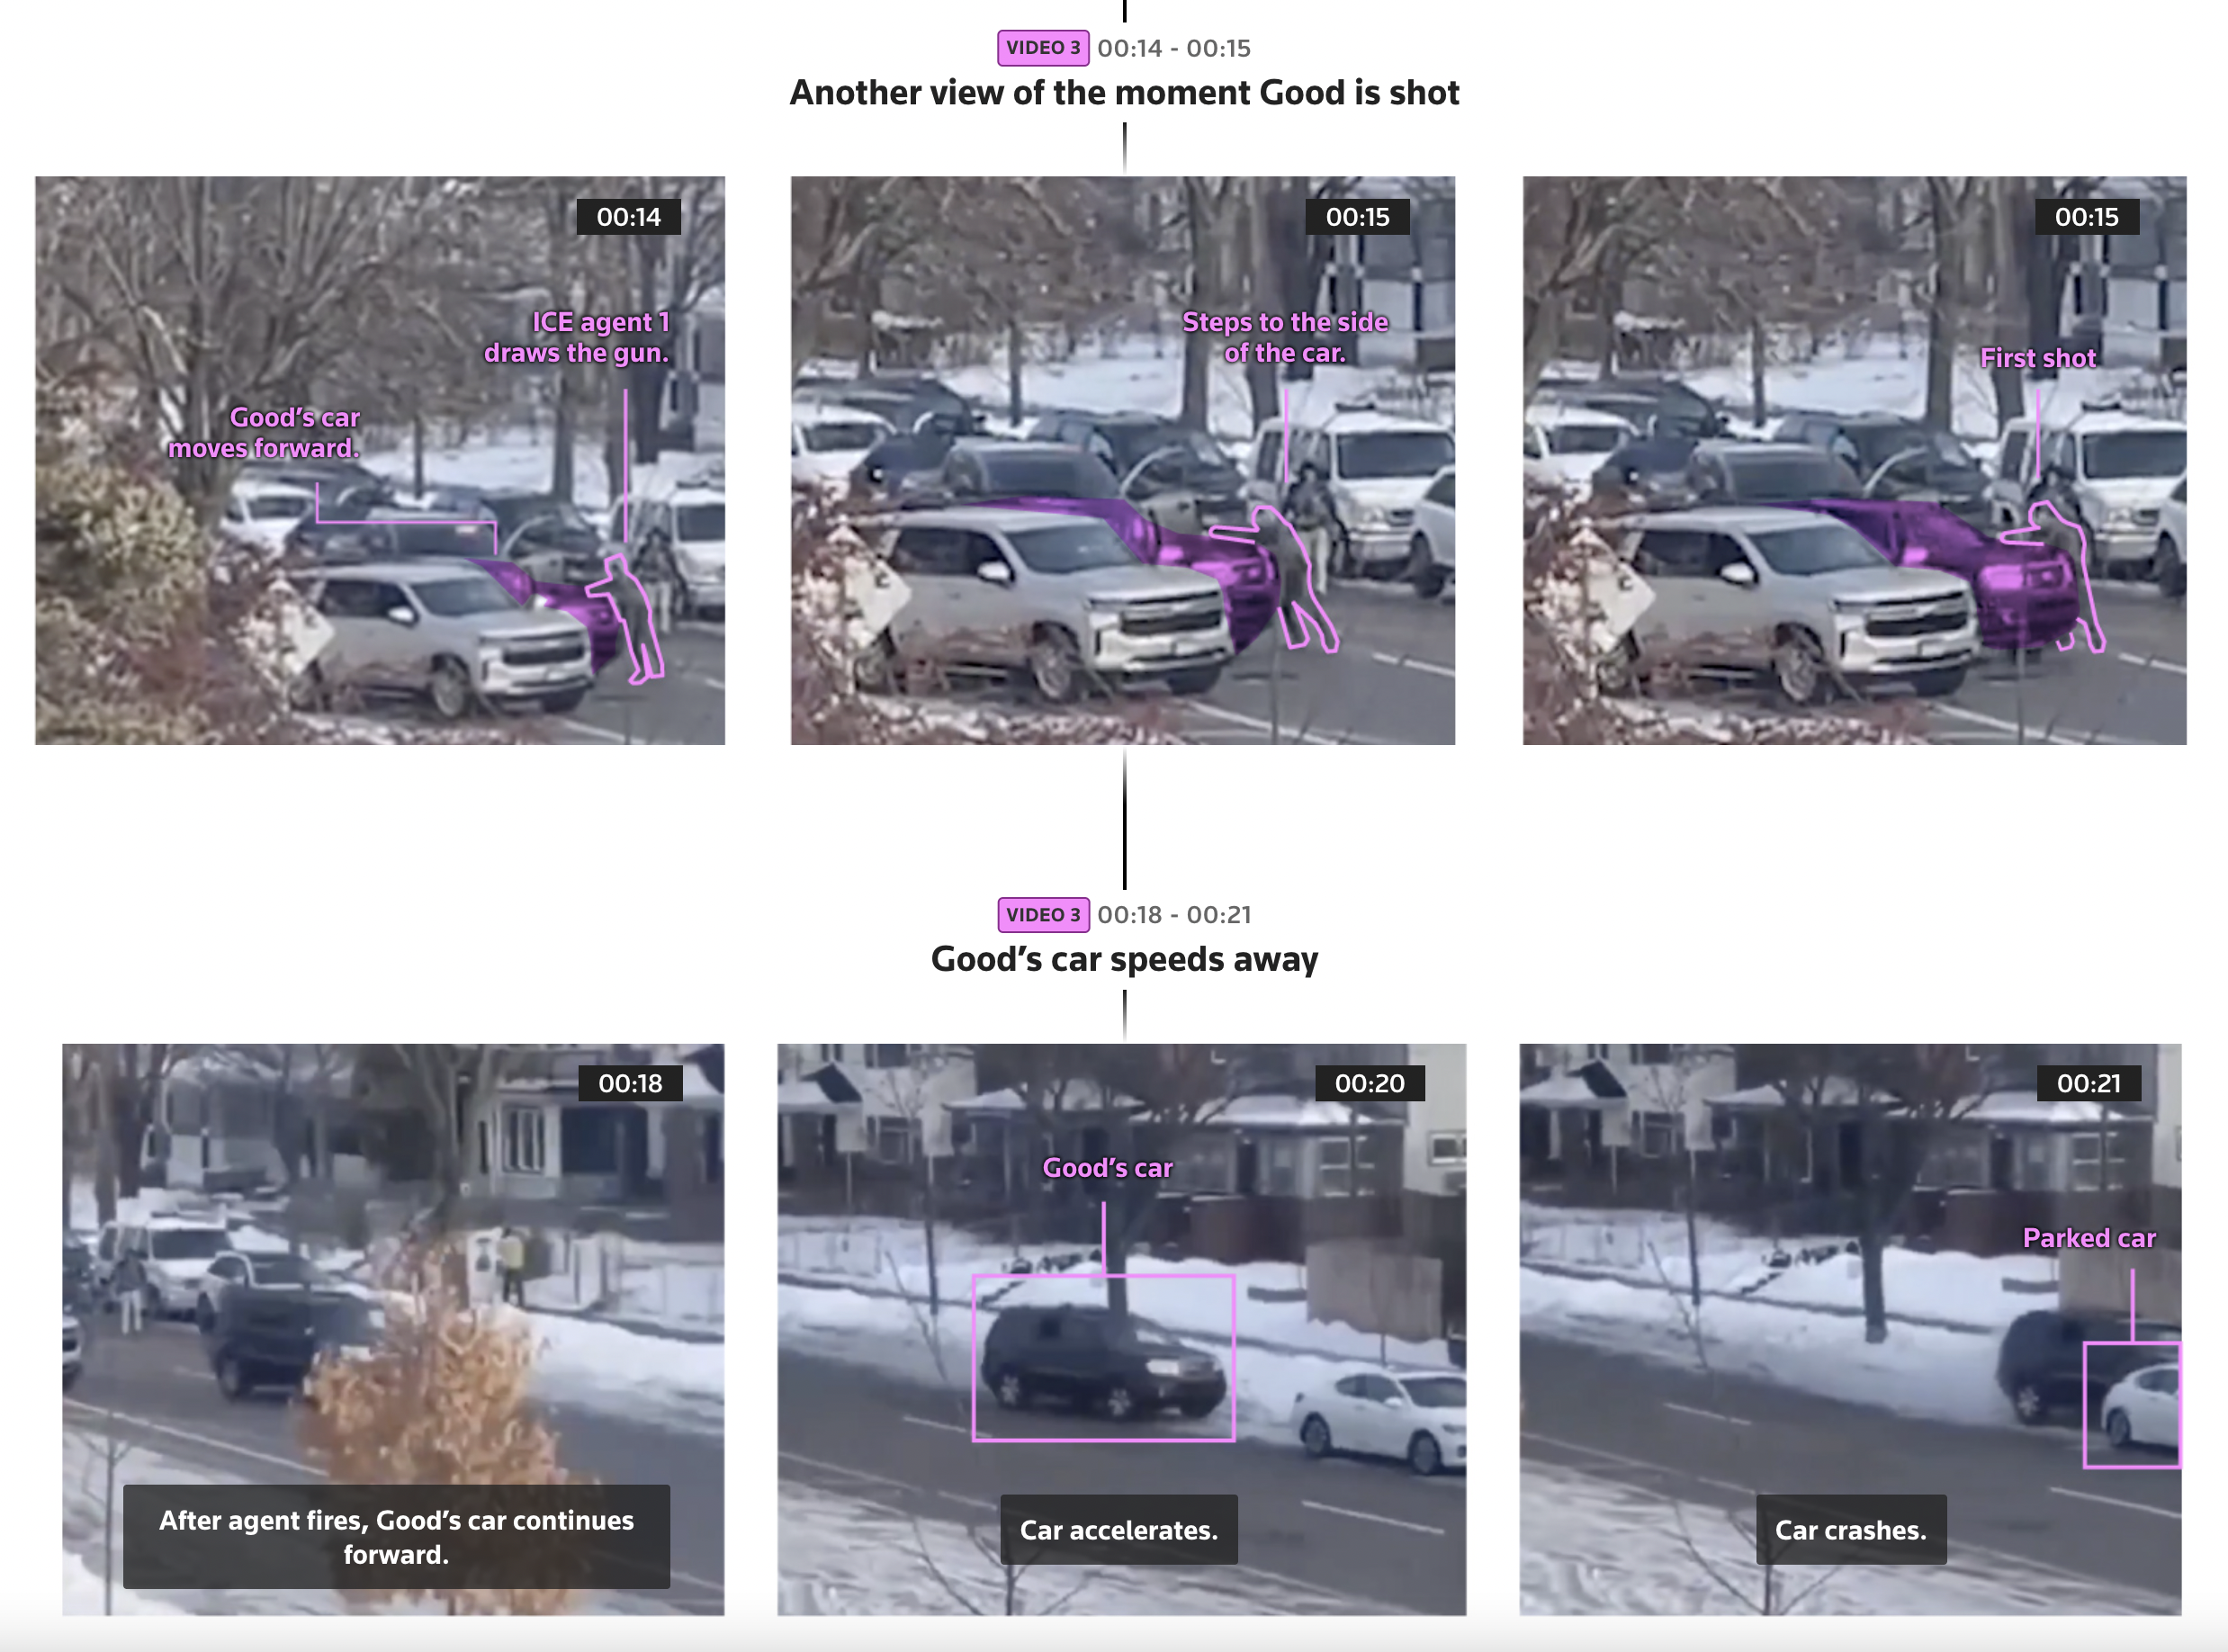
Image: Screenshot / Reuters
An officer from the US immigration agency ICE fatally shot 37-year-old Renee Good in her car during street operations in Minneapolis, Minnesota, triggering protests across the country. Reuters analyzed multiple video sources of the incident, including footage from the officer’s mobile phone, annotating stills to reconstruct the sequence of events. The videos showed Good speaking to the officer through her rolled-down window before reversing, while the officer positions himself in front of the moving vehicle. One second later, as she begins to turn her car’s wheels away from him, he fires three shots through the windshield and open driver’s side window, two of which strike Good. The analysis could not determine exactly how the car and officer made contact; Reuters consulted experts who questioned why the officer placed himself in the path of the vehicle and whether lethal force was proportionate in a non-violent encounter, noting the actions require further review.
Can AI Do Your Job?
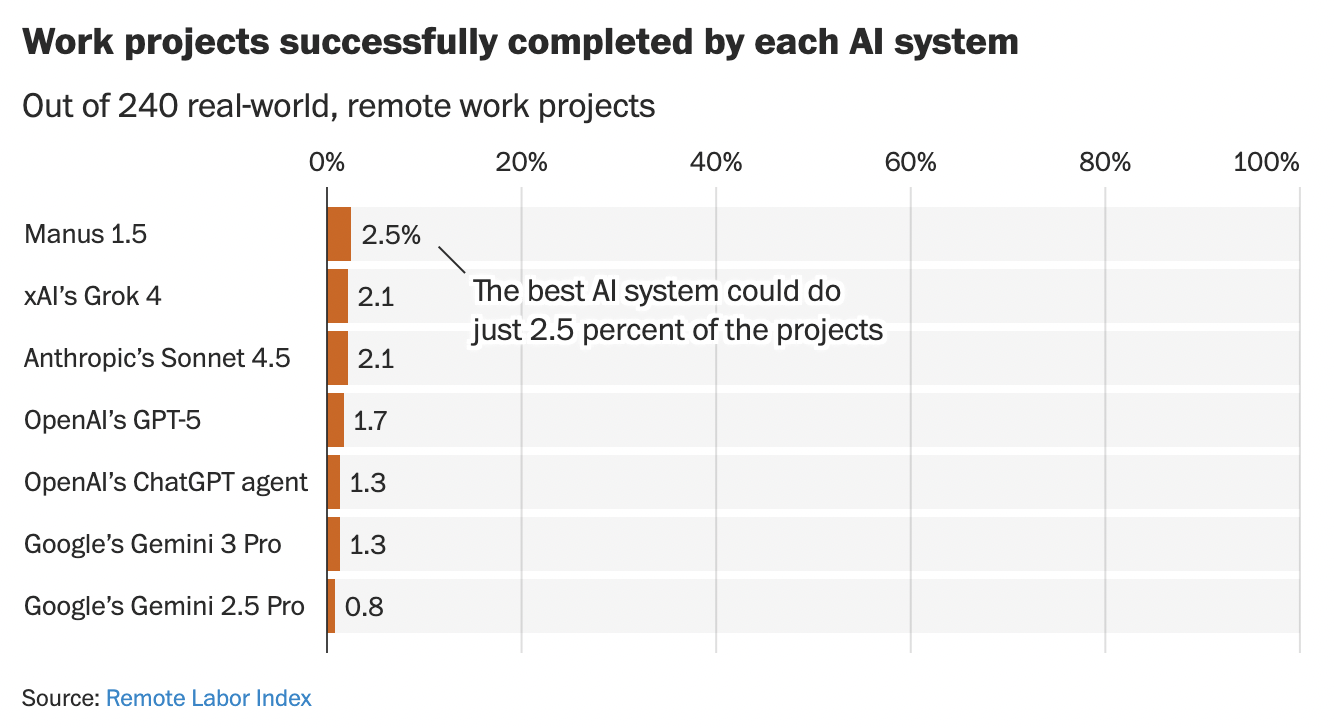
Image: Screenshot, The Washington Post
Three years after ChatGPT arrived, AI can do a lot — write, code, generate images — but a new analysis presented by The Washington Post, drawing on research from the Center for AI Safety and Scale AI, shows it still can’t do near as much work as humans do every day. Researchers collected hundreds of real freelance assignments, such as 3D product animations, coding web games, and making architectural sketches, and ran them through the top AI systems: ChatGPT, Gemini, Sonnet, Grok, and Manus. The results showed that the best AI platform managed just 2.5% of tasks correctly. Mistakes were telling, such as dashboards with missing data, product designs shape-shifting mid-creation, and other visual design errors. According to researchers, AI struggles with memory and visual reasoning, and the Post’s summation suggests the AI labor takeover is still a long way off.
The Most-Read Wikipedia Pages of 2025
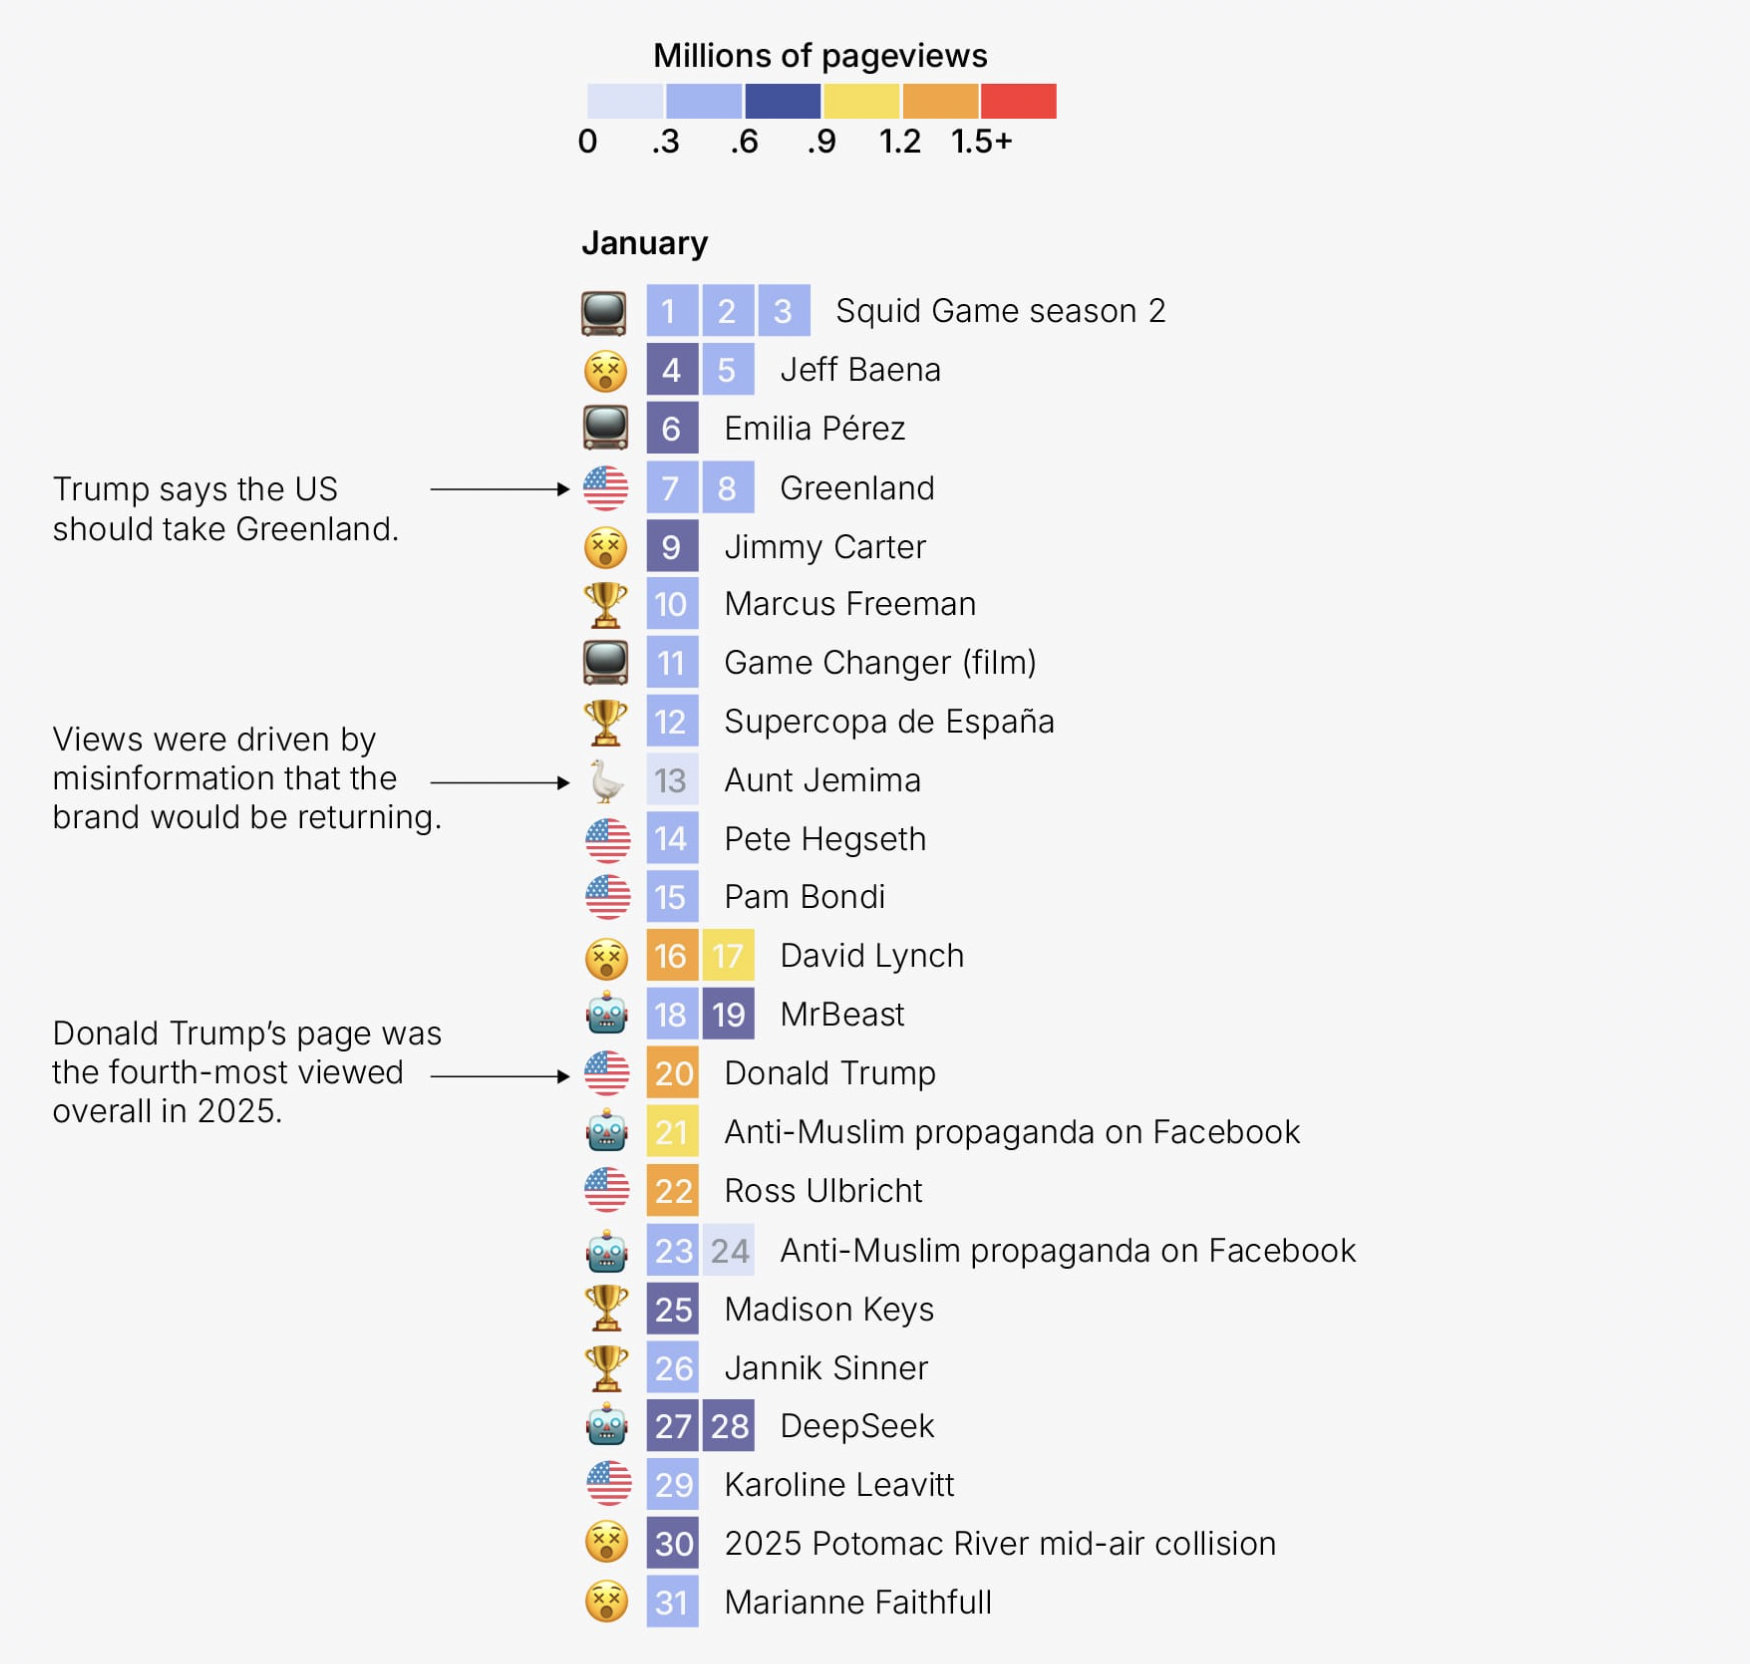
Image: Screenshot, Not-Ship
To kick off 2026, Amanda Shendruk at data newsletter Not-Ship scraped Wikipedia data to find the most-read English-language page for every day of 2025. Grouping pages into categories visually denoted by emojis, she found that just over half of all days were dominated by entertainment or recent deaths. Another chart ranked pages by popularity across each month, revealing patterns and surprising echoes: on January 7-8 last year, Greenland spiked in pageviews after Trump’s comments about the US potentially “buying” it. This year, he’s thinking about taking it by force. In 2025, Trump’s own page was the fourth-most read according to Wikipedia, while Charlie Kirk, the assassinated conservative activist, was the most viewed page.
Bollywood’s Love Affair With Love is Over
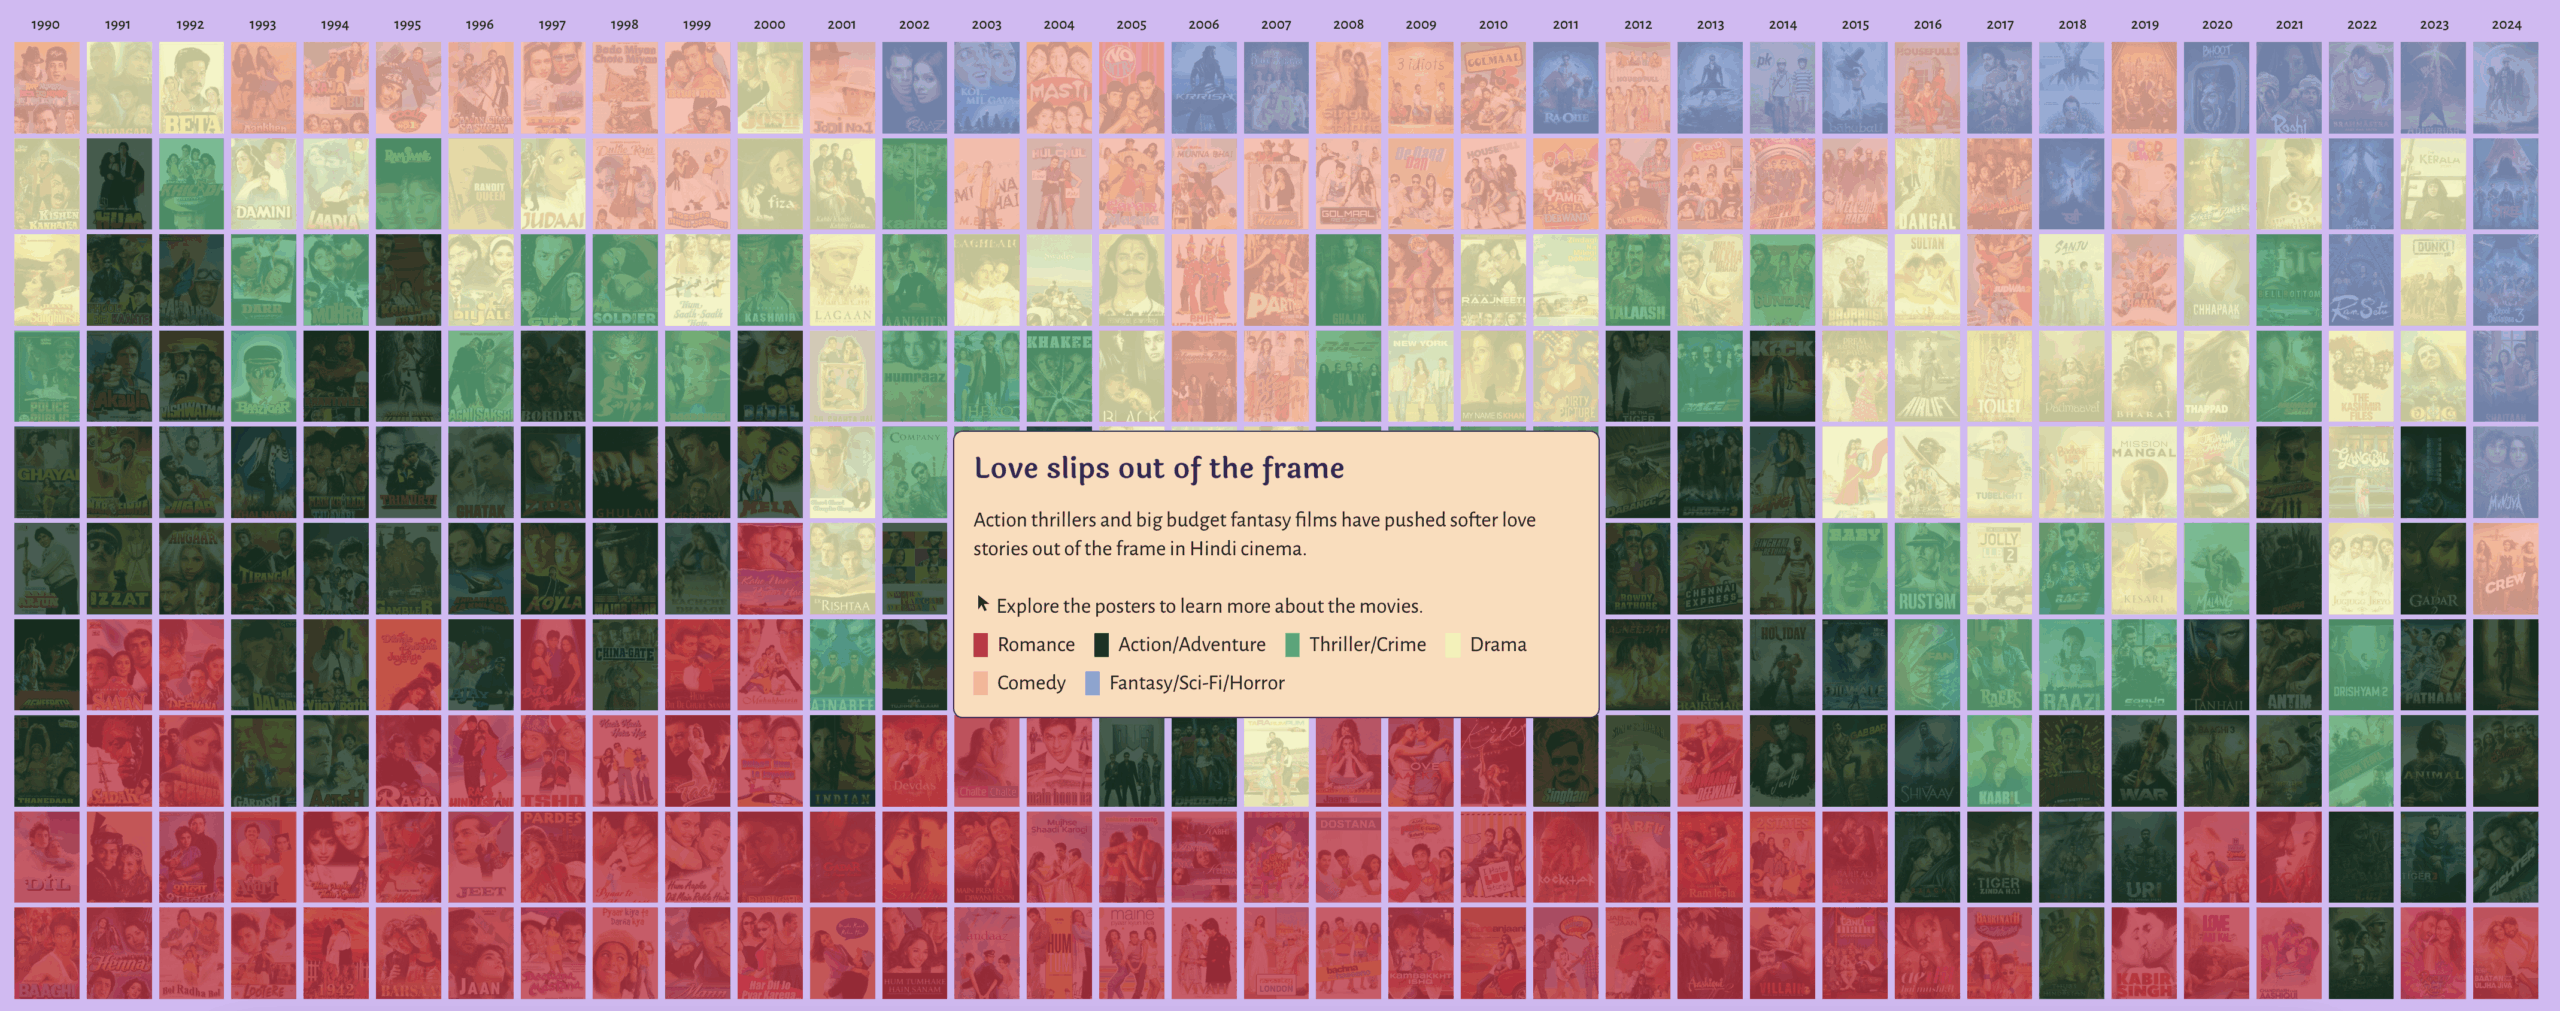
Image: Screenshot, Kontinentalist
For Kontinentalist, Surbhi Bhatia examined how Bollywood’s dominant genres have shifted over three decades, tracing a sharp decline in romance in favor of action, thriller, and nationalist productions that have steadily risen in the past two decades. Analyzing the top 10 highest-grossing Hindi films each year between 1990 and 2024 using data from Box Office India, the story classifies 350 titles by primary genre using a large language model (LLM) trained on plot, cast, and narrative structure. They refined the prompts, asking it to detect tone, historical context, political themes, and intended audience impact. The findings are presented through color-coded, image-based grids of movie posters, anchoring the data in familiar cultural icons while showing changes in favored genres over time. These visuals revealed romance giving way to hyper-masculine action dramas, political biopics, and military films that mirror India’s increasingly nationalist climate. Paired with a time-series plot tracking cinema foot traffic, the analysis shows how theatrical attendance has shifted across genres, with post-pandemic audiences drawn to action films. It also traced how leading stars’ careers have moved from romantic leads to action heroes aligned with the government, signaling Bollywood’s growing intertwining with state ideology.
Hanna Duggal is the writer of GIJN’s fortnightly Top Ten in Data Journalism column, and a data journalist at AJ Labs, the data, visual storytelling, and experiments team of Al Jazeera. She has reported on issues such as policing, surveillance, and protests using data, and reported for GIJN on data journalism in the Middle East, investigating algorithms onTikTok, and on using data to investigate tribal lands in the US.
Introduction to Investigative Journalism: Data Journalism
Data Cleaning Tools and Techniques for Non-Coders
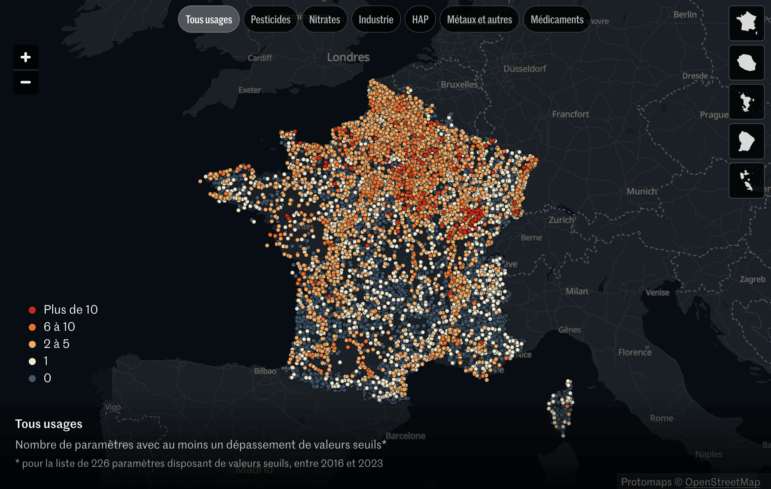
How a Le Monde Team Uncovered 300 Contaminants in France’s Groundwater
Looking Back on Five Years: How the Sigma Awards Have Rallied and Inspired Data Journalism Excellence
Editor’s Pick: Best of Data Journalism from 2025

My Favorite Tools: Sigma Award-Winning Data Journalist Leonardo Nicoletti
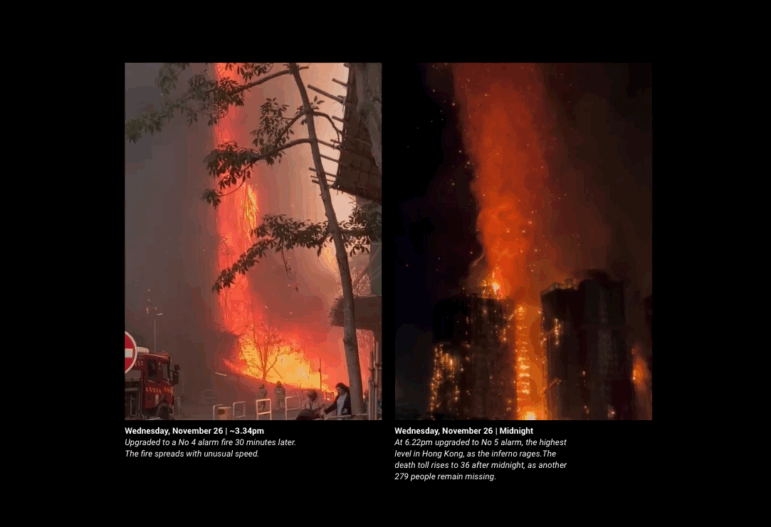
Hong Kong’s Deadly Fire, Tuna Fishing’s Labor Abuses, AI Deepfakes Target Ukraine Press, China’s ‘Shadow’ Fleet Preps for Invasion

From Data to Storytelling: Concept and Design Tips from the Financial Times’ John Burn-Murdoch

This work is licensed under a Creative Commons Attribution-NoDerivatives 4.0 International License
Republish our articles for free, online or in print, under a Creative Commons license.
Republish this article
This work is licensed under a Creative Commons Attribution-NoDerivatives 4.0 International License
Read Next
Data Journalism Top 10 Editor's Picks
Editor’s Pick: Best of Data Journalism from 2025
Our roundup of standout data journalism from the past year highlights projects that delve into conflicts in the Middle East, Ukraine, and Africa, that explore the rise of AI, and interrogate global trade wars.
Data Journalism My Favorite Tools
My Favorite Tools: Sigma Award-Winning Data Journalist Leonardo Nicoletti
The data visualization expert and former academic stresses the importance of having an ‘interdisciplinary mindset’ when approaching data-driven stories.
Data Journalism Top 10
Hong Kong’s Deadly Fire, Tuna Fishing’s Labor Abuses, AI Deepfakes Target Ukraine Press, China’s ‘Shadow’ Fleet Preps for Invasion
Our round-up of the best in recent data journalism also highlights deepfakes targeting Ukrainian journalists, Europe’s sprawling landfills, and how Peru’s youth are locked away in prisons.
Data Journalism
From Data to Storytelling: Concept and Design Tips from the Financial Times’ John Burn-Murdoch
The chief data reporter for the Financial Times discusses how he considers the use of text, color, and annotation to aid visual storytelling through charts and graphics.