
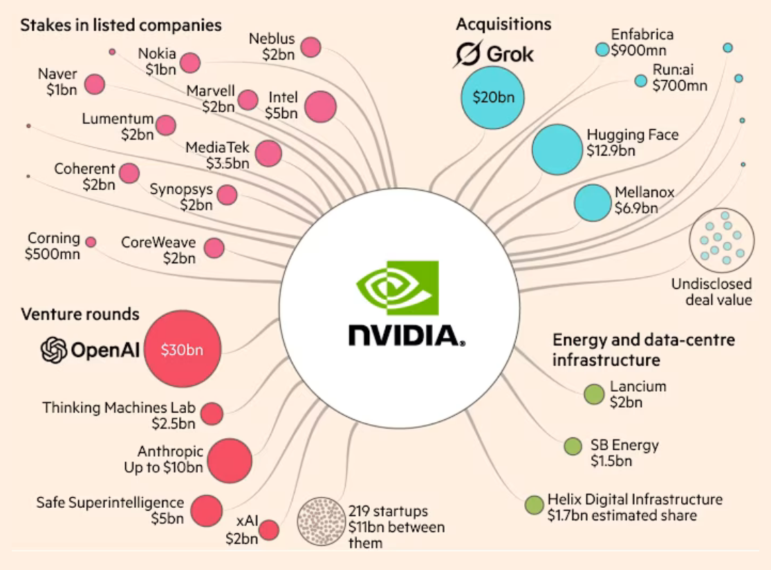
The Financial Times mapped out Nvidia's central role in the AI economy. Image: Screenshot, Financial Times
Nvidia’s Tangled Web, Risks of Smartphone Tracking in Japan, Banned Pesticides in Brazil, and Fox News’ WNBA Culture War Coverage

How Many Journalists Does It Take to Fill an Olympic Swimming Pool? GIJN’s Guide to Size and Number Comparisons

Investigative Journalism Week 2026 Resources
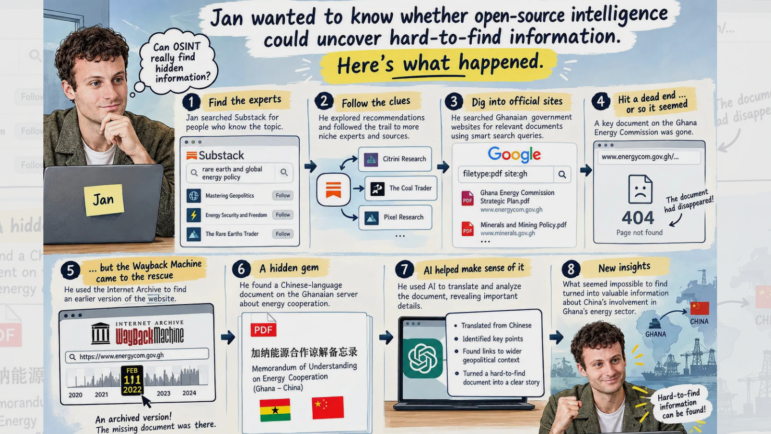
International Research Guide: How to Find Experts and Hidden Documents on Any Topic

Guide to Investigating Tech and AI in Modern Warfare
AI chip maker Nvidia has been roiled by the sudden resignation of its CEO, Jensen Huang, after revelations of his multiple affairs, including one with an alleged Chinese spy, came out. The company has served as a linchpin to the AI industry and, increasingly, the US economy as a whole. So, the Financial Times looked at its critical role serving AI labs and other tech companies in the US and abroad. Our roundup of the Top 10 in Data Journalism, looking at stories from November 5 to 18, also includes an analysis of how smartphone location tracking can pose a security risk to Japanese governmental and defense officials, India’s air quality index and how it is measured by sheets.works, Datadista’s assessment of Spain’s pension fund ahead of snap elections on November 29, The Pudding’s deep dive into how Fox News covers the Women’s National Basketball Association (WNBA) in the US, and Bloomberg’s investigation into banned pesticides detected in the water in Brazil.
Nvidia Caught in a Tangled Web
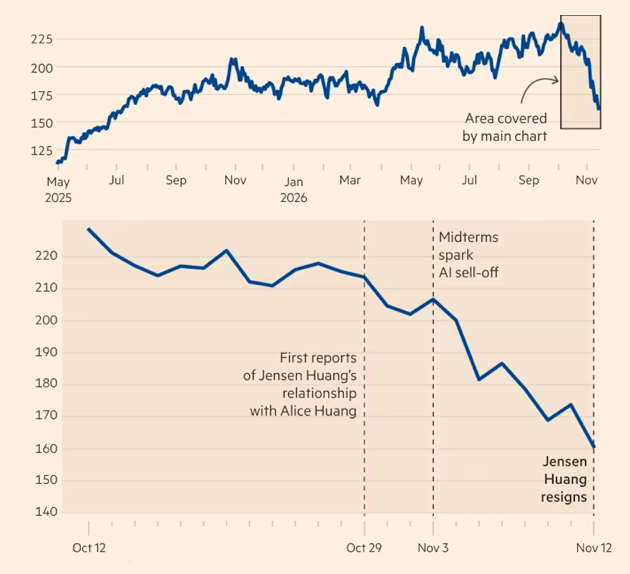
The Financial Times tracked the Nvidia stock price selloff (in US$) amid CEO Jensen Huang’s fall over the past month. Image: Screenshot, Financial Times
The CEO of AI chipmaker Nvidia, Jensen Huang, resigned this past week following a firestorm of headlines about his extramarital affairs — one of which was with an alleged Chinese spy — and the implications for the AI industry and national security. The Financial Times, pointing out that under Huang Nvidia “ploughed its vast profits into bankrolling AI start-ups, suppliers and the customers buying its chips,” created a bubble map to show Nvidia’s web of AI deals and investments, including the major companies in which it has bought a stake, its acquisitions, its venture rounds, and energy and data-center infrastructure. Nvidia expanded quickly, they noted, and now underpins a significant amount of the current AI ecosystem. It’s too early to assess the full impact on the AI industry of Huang’s departure and the fallout at Nvidia, but it is potentially huge.
Smartphone Location Data and Security Risks
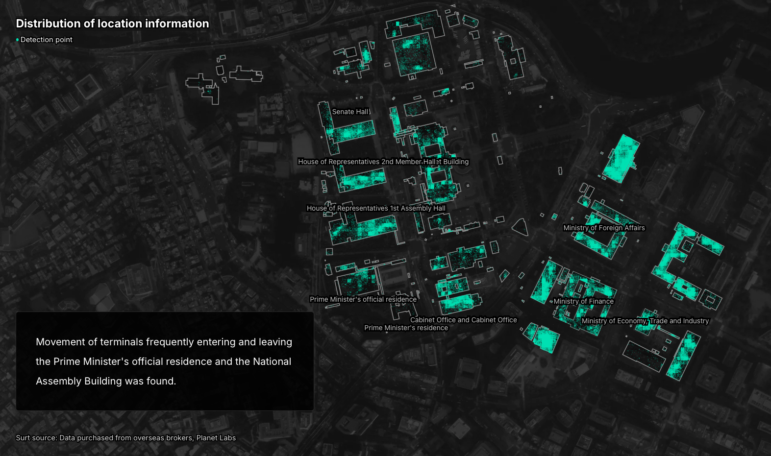
Image: Screenshot, Nikkei
Smartphone location data from Japan is being sold by overseas brokers, and some of it could be used to track people moving in and out of the country’s most sensitive sites, from the prime minister’s official residence to military bases. Nikkei’s visual data team approached 18 data brokers and analyzed a month of GPS records covering more than 40 million device IDs. They then cross-checked the results against Ministry of Defense data and real estate registration records. A scrollytelling map zoomed in on central Tokyo, where devices were detected around the prime minister’s residence, the National Diet or legislative chamber, and the Defense Ministry’s Ichigaya headquarters. A nationwide map traced devices moving between military sites, and another followed a single phone’s path after it left a military hospital. Using the same methods, reporters were able to identify individual Maritime Self-Defense Force (JMSDF) officers from where they regularly stayed overnight, a pattern that experts warned could help an adversary pick out targets in wartime.
Banned Toxic Pesticides Smuggled into Brazil
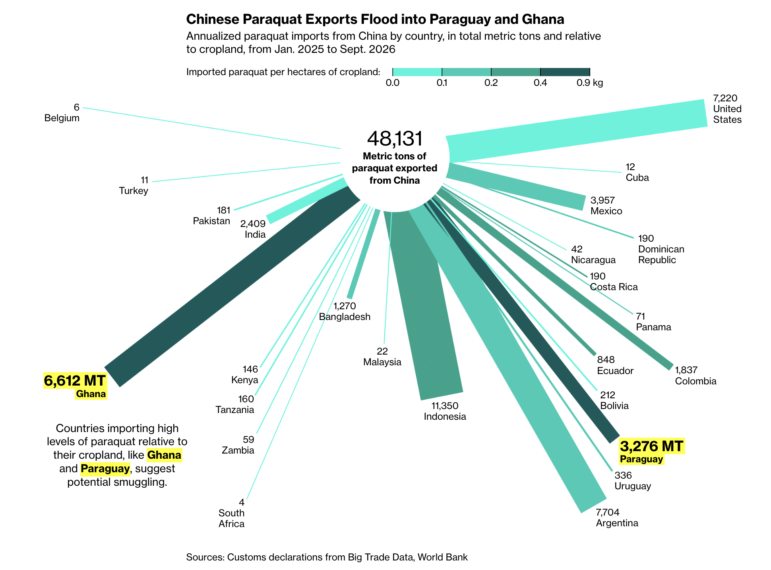
Image: Screenshot, Bloomberg
Brazil has banned several of the most dangerous pesticides, but hundreds of people are still poisoned by them every year, some of them fatally. Bloomberg, in partnership with Lighthouse Reports and Reporter Brasil, traced how banned chemicals still reach Brazilian farms by analyzing customs records and national water tests. A radial chart broke down China’s exports of paraquat, a herbicide Brazil banned in 2020 over its links to Parkinson’s disease. While Brazil imported almost no paraquat between January 2025 and September 2026, neighboring Paraguay took in 5,500 metric tons, an amount that one expert said should “far exceed” domestic farming needs. A second map of drinking water test results showed that a third of Brazilian municipalities that ran tests between 2023 and 2026 found banned pesticides in their drinking water, with 28% detecting paraquat, evidence that the chemicals are still being smuggled across the border from loosely regulated neighbors such as Paraguay.
Leaked Documents Show Extent of Russian Deaths in Ukraine
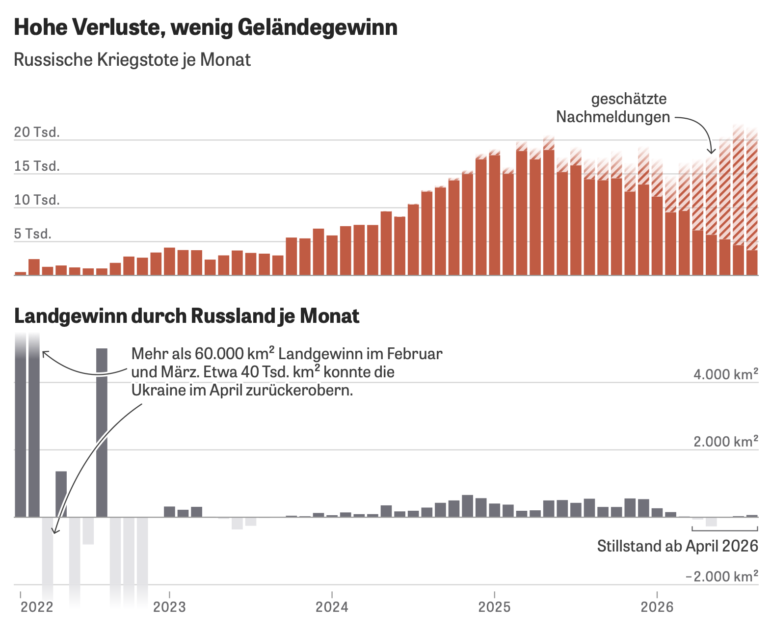
Die Zeit chronologically tracked Russia’s battlefield casualties (above, red) against land gains and losses (below, gray) per month of its war in Ukraine. Image: Screenshot, Die Zeit
How many Russian soldiers have died in the war in Ukraine? At least 441,000, according to Die Zeit’s analysis of Russian government records that Belarusian and Ukrainian hackers took from the national statistics agency, Rosstat. Die Zeit, one of several outlets to receive the leak, worked through 11.6 million anonymized death records that ran from 2021 to September 2026 to show who is dying and where. Paired bar charts set monthly deaths against monthly territorial gains, showing losses climbing as Russia’s advance slowed almost to a halt. An animated bubble map of the Donbas region showed where soldiers died, with more than 250,000 killed along the Donetsk front alone. Analysis of the data also revealed that the median age of those killed rose from about 32 before September 2022 to nearly 40 in more recent data as the ranks of professional soldiers have been bolstered by conscripts and volunteers. A shaded map of Russia showed that poorer eastern regions near the Chinese border lost the most men relative to their population. The story closed with a chart showing that families of missing soldiers often waited nearly a year for a court to declare them dead, delaying the compensation they were owed.
Fox News’ Culture War Lens for WNBA Coverage
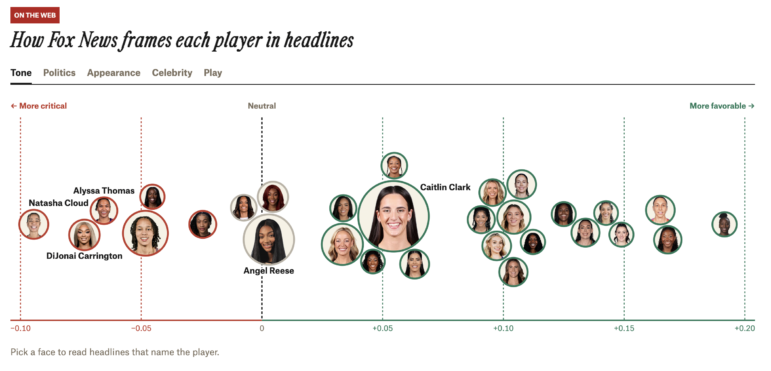
Image: Screenshot, The Pudding
The rising popularity of women’s basketball in the US has dragged the sport into politics, turning some players into symbols in a wider culture war. The Pudding analyzed more than 30,000 articles about the Women’s National Basketball Association (WNBA) published from 2019 to 2026, comparing Fox News and its sports site OutKick with six other outlets. It also examined more than 8,000 on-screen news banners from Fox News, CNN, and MSNBC. A dot chart ranked players by how much more or less Fox News covered them than other outlets did. It found that some players took a larger share of Fox News’ WNBA headlines, with outsized attention also on players tied to political debates. Compared to other sites, there was comparatively little coverage of several “Most Valuable Players” and “All-Stars.” Side-by-side word charts, built with a text analysis method known as “fightin’ words,” showed other outlets focusing on game play while Fox News’ most distinctive terms were tied to “political flashpoints, leaning heavily into conservative buzzwords like ‘white privilege,’ ‘national anthem,’ and ‘biological men,’” the Pudding wrote.
Measuring Air Quality During Smog Season
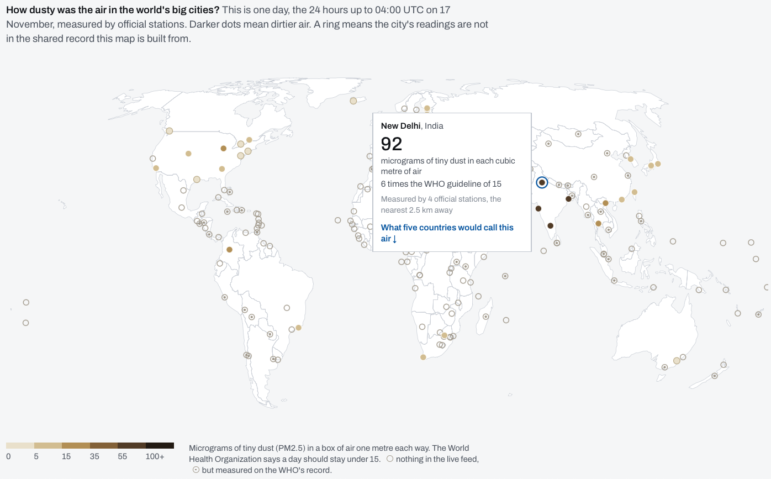
Image: Screenshot, sheets.works
Air carries pollutants such as ozone, nitrogen dioxide, and tiny PM10 and PM2.5 particles, the finest about 30 times thinner than a human hair and able to lodge deep in the lungs. Every winter, crop-burning smoke, traffic fumes, and cold, still air trap a thick smog over Delhi, and this year’s Diwali fireworks on November 8 pushed the pollution levels to peak highs. Drawing on official agency data, peer-reviewed studies, and OpenAQ readings (which gather government networks into one open record), data analysis site sheets.works explained how a single air quality score is calculated, and why it can understate the worst pollution. A global dot map compared particle levels in major cities over one day, and a diagram showed the roadside monitor that weighs particles in the air. It revealed how the widely used 24-hour average pollution level lags behind real conditions, missing smoke at its peak and still counting it the next morning. Color-coded scales show how different countries grade the same amount of pollution — with India and China counting as lightly or moderately polluted air that would be considered “unhealthy” in the US.
Carbon Emissions of US Data Centers
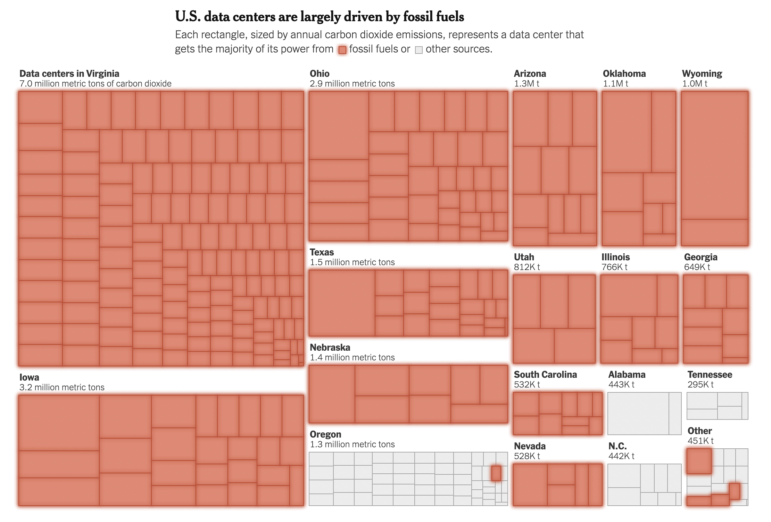
Image: Screenshot, The New York Times
The largest data centers in the US emit an estimated 25.7 million metric tons of carbon dioxide a year, roughly equivalent to the emissions of the countries Denmark or Bolivia, according to a Harvard-led study published in Nature Sustainability. The New York Times reported on the research, covering 403 data centers between May 2024 and April 2025, which together used almost 2% of US electricity and represented about 0.5% of US carbon emissions. Data centers in just three states — Virginia, Iowa, and Ohio — accounted for about half of the emissions in the study, the NYT noted. With no public list of facilities available, researchers drew on a commercial dataset and satellite imagery to locate data centers, then estimated their emissions from the power plants supplying each regional grid. Treemaps showed each facility’s annual emissions and whether it ran mainly on fossil fuels or other energy sources. A cluster map of Virginia — the state at “the heart of the data center boom” and home to more than 140 data centers — showed it accounted for more than a quarter of the emissions, with about 60% of its data centers’ power coming from fossil fuels.
Human Sounds in Space
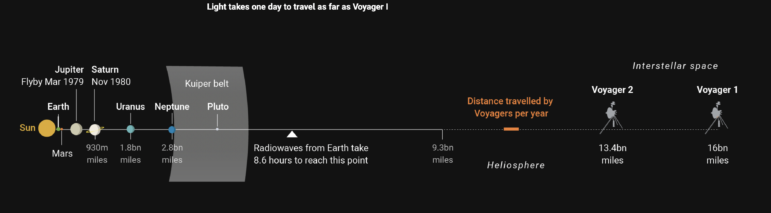
Image: Screenshot, The Times
In 1977, NASA launched two Voyager probes. Each was carrying the Golden Record — a gold-plated phonograph disc of music, natural sounds, voices, and images, meant as a greeting to any aliens who might find it and an “epitaph” for humanity. On November 18, Voyager 1 passed a milestone, reaching one light day away (16,094,799,096 miles) from Earth, farther than any spacecraft has gone before. The Times explained how a small team chose what the disc would say about life on Earth, including spoken “hellos” in dozens of languages, more than a hundred photographs and drawings, and an hour and a half of music that spans Bach to rock ’n’ roll. Two diagrams help readers grasp the scale of the journey, one showing how far away a light-day is, and the other placing both the Voyager journeys within the solar system and beyond. An illustrated scrolly guide to the disc’s engraved cover decoded its directions for alien listeners, such as how to play the disc and turn its sounds into images, a map pointing back to the sun, and a trace of uranium that helps to date the probe’s age.
Tracking Spain’s Pension ‘Piggy Bank’ Ahead of Elections
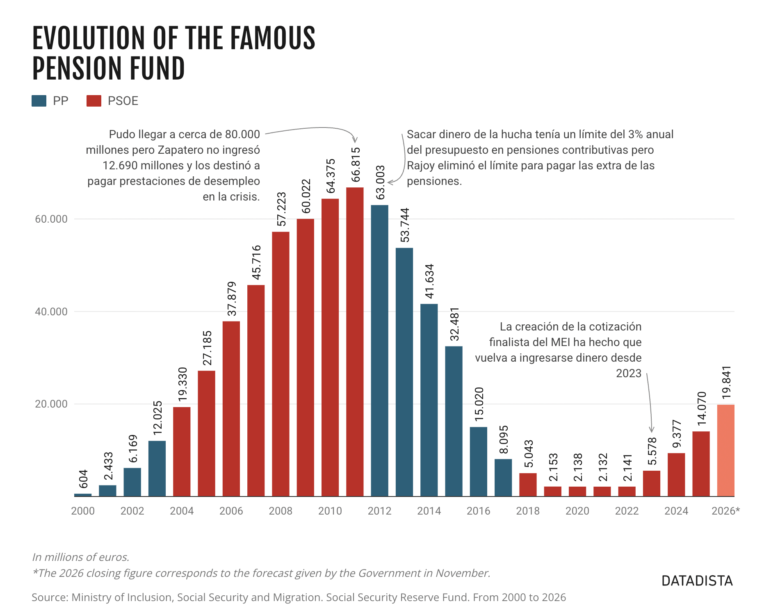
Image: Screenshot, Datadista
Spain is heading into a snap general election on November 29. With election day looming, Datadista examined the history of the country’s pension reserve fund (Hucha de las Pensiones), a savings pot built up in good years to top up pensions when workers’ contributions fall short, which has been subject to “partisan confrontation” among the main political parties. A column chart traced how the fund, established in 2000, grew to €66.8 billion ($73.2 billion) in 2011 before shrinking to just €2.1 billion ($2.3 billion) by 2021. A second chart showed the withdrawals made between 2012 and 2019 by different parties, after the previous government changed the law to lift a 3% cap on annual withdrawals to deal with the fallout of the financial crisis that hit the country in this time. Mandatory pension savings contributions are now refilling the fund, which can’t be touched until 2033.
What Can an Hour’s Wage Buy in South Africa?
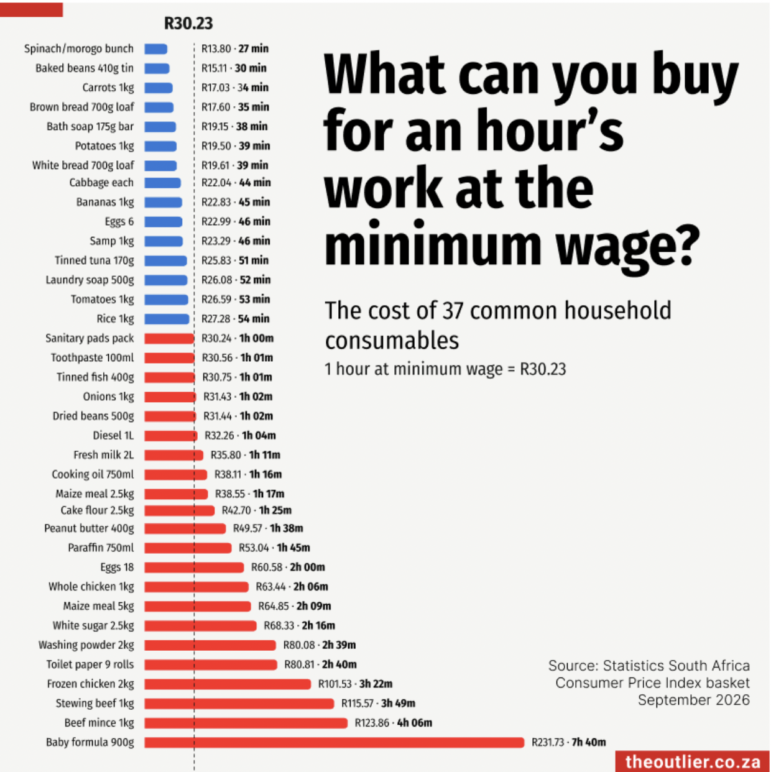
Image: Screenshot, The Outlier
A worker earning South Africa’s minimum wage of R30.23 (US$1.78) an hour has to work more than seven hours to afford a tin of baby formula, and an hour’s work at minimum wage won’t buy a pack of sanitary pads. The Outlier used price data from Statistics South Africa’s September 2026 consumer price index (CPI) basket to work out how long it takes a minimum-wage earner to pay for 37 household essentials. A bar chart ranked each item by the minutes of work it costs, with blue bars for the 15 items an hour’s pay can buy and red bars for the 22 it can’t. Fresh produce, bread, and 1kg of rice fall comfortably under the hour. Sanitary pads, cooking oil, and milk all cost more than an hour’s wage.
Hanna Duggal is the writer of GIJN’s fortnightly Top 10 in Data Journalism column, and a data journalist at AJ Labs, the data, visual storytelling, and experiments team of Al Jazeera. She has reported on issues such as policing, surveillance, and protests using data, and reported for GIJN on data journalism in the Middle East, investigating algorithms onTikTok, and on using data to investigate tribal lands in the US.
How Many Journalists Does It Take to Fill an Olympic Swimming Pool? GIJN’s Guide to Size and Number Comparisons
Investigative Journalism Week 2026 Resources
International Research Guide: How to Find Experts and Hidden Documents on Any Topic
Guide to Investigating Tech and AI in Modern Warfare
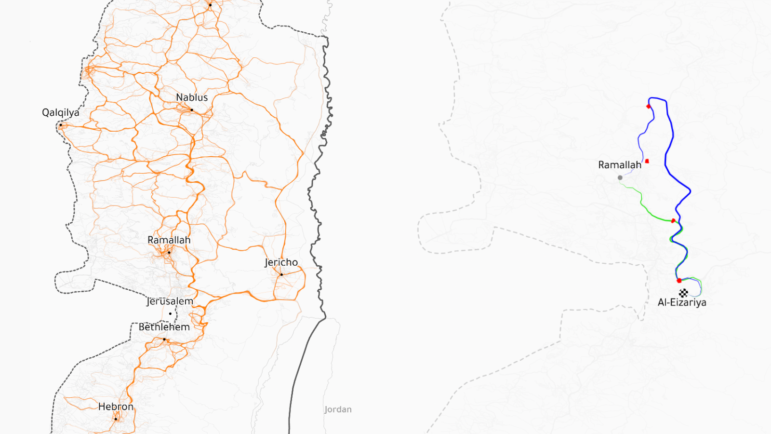
Israeli Checkpoints in the West Bank, Arctic Global Warming, Brazil’s Women Legislators, Inventing a Migrant Crisis in Ukraine

Peruvians Fighting for Russia, Israel’s Illegal Settlements, Mali’s Drone War, and the Data Center Heat Effect
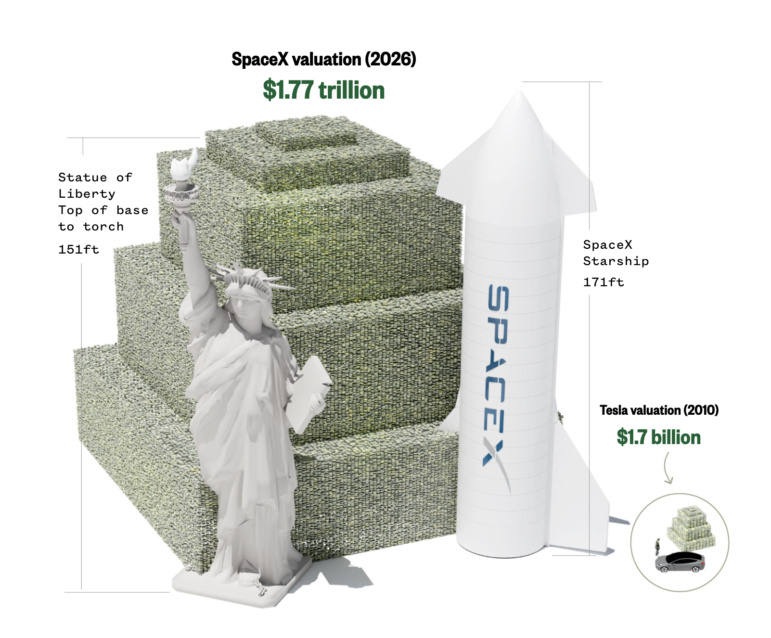
Visualizing a Trillion Dollars, India’s Warming Cities, Russian Mercenaries at Sea, and World Cup Player Physiques
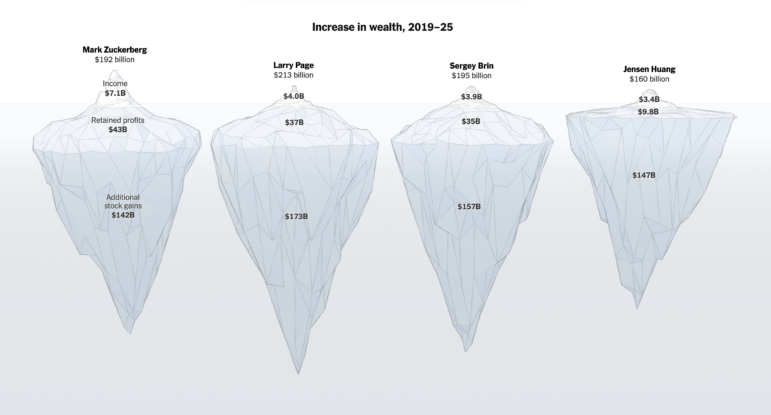
‘Super’ El Niño Threat, Myanmar Villages Razed, California’s Billionaire Tax Bill, and South Africa’s Murder Rate

This work is licensed under a Creative Commons Attribution-NoDerivatives 4.0 International License
Republish our articles for free, online or in print, under a Creative Commons license.
Republish this article
This work is licensed under a Creative Commons Attribution-NoDerivatives 4.0 International License
Read Next
Data Journalism Top 10
Israeli Checkpoints in the West Bank, Arctic Global Warming, Brazil’s Women Legislators, Inventing a Migrant Crisis in Ukraine
Also highlighting how pro-Russian channels fabricated a mass migration threat in Ukraine, charting South Africa’s micro schools, and how beliefs in an afterlife vary around the world.
Data Journalism Top 10
Peruvians Fighting for Russia, Israel’s Illegal Settlements, Mali’s Drone War, and the Data Center Heat Effect
Also highlighting social media attacks against Brazil’s female political candidates and investigating Myanmar’s jade trade.
Data Journalism Top 10
Visualizing a Trillion Dollars, India’s Warming Cities, Russian Mercenaries at Sea, and World Cup Player Physiques
Also highlighting how films portray Ukrainians, increasing tree cover in Spain, and how couples meet.
Data Journalism Top 10
‘Super’ El Niño Threat, Myanmar Villages Razed, California’s Billionaire Tax Bill, and South Africa’s Murder Rate
Also highlighting exploitation of journalists in Egypt, Argentina’s returning World Cup squad, and the strain on Singapore’s aging caregivers.