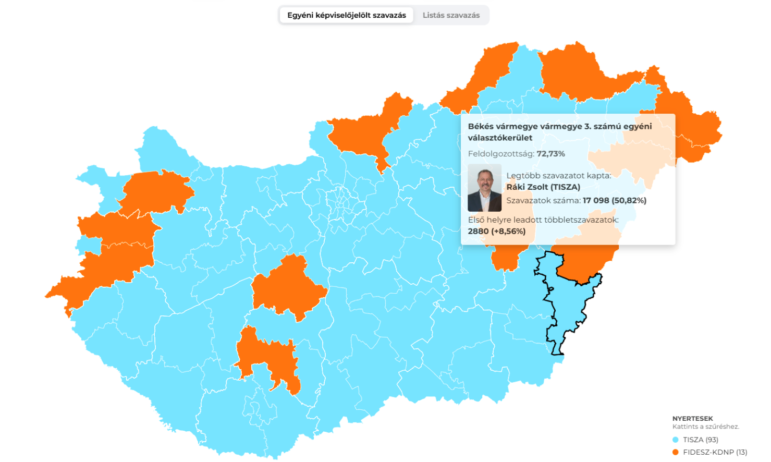
Viktor Orbán's landslide electoral defeat in Hungary, where the opposition Tisza Party handily won in districts (light blue) across the country. Image: Screenshot, Atlatszo
Hungary’s Historic Election, Artemis II’s Lunar Journey, Strait of Hormuz Shipping Crisis, and Three Years of War in Sudan
After completing NASA’s first crewed fly-by of the Moon in more than 50 years, the Artemis II team returned to Earth — drawing worldwide fascination, particularly from Australia’s ABC, which took readers on a visual journey through the mission and the space milestones that preceded it. Our roundup of the Top 10 in Data Journalism considers stories from March 30 to April 15, and also features Atlatszo’s live-tracking of the seismic Hungarian election that ended Prime Minister Viktor Orbán’s 16-year rule, the South China Morning Post’s reconstruction of a deadly Hong Kong housing fire, the Guardian’s look at how Earth’s orbit is becoming crowded with satellites, and Sky News’s assessment of Russian dominance in the Arctic.
Exploring the Dark Side of the Moon

Image: Screenshot, Australian Broadcasting Corporation
After NASA’s Artemis II lifted off from Florida’s Kennedy Space Center on April 1, its four astronauts traveled further from Earth than any humans so far — and were the first to travel as far as the Moon since Apollo 17 in 1972. The Australian Broadcasting Corporation built a scrollytelling 3D animation to take readers through every part of the journey. Using distance as its visual axis, the piece marked each milestone along the full 406,771 kilometers (252,756 miles) from launch pad to the Kármán line — regarded as the beginning of space — to the International Space Station and beyond. A full orbital diagram traced the mission’s complete arc from launch to splashdown in the Pacific.
Orbán’s Landslide Defeat
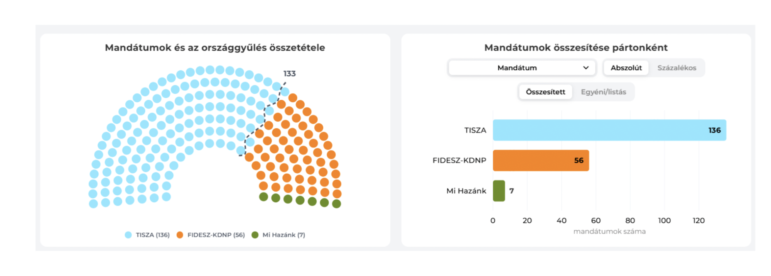
Péter Magyar and the Hungarian opposition party Tisza won a supermajority in parliament in Sunday’s historic election. Because it surpassed the two-thirds threshold of 132 seats, Tisza will have the legislative power to undo many of the policies of current Prime Minister Viktor Orbán’s last 16 years of rule. Image: Screenshot, Atlatszo
After 16 years of Viktor Orbán’s rule, Hungary’s April 12 election delivered a historic verdict: opposition leader Péter Magyar’s Tisza party won a landslide victory, ending the Fidesz party’s grip on power. Hungarian investigative outlet Atlatszo tracked the count in real time using constituency-level result maps and seat projection charts, documenting how the scale of the shift played out in every constituency. Tisza’s candidates led in areas once considered safe Fidesz territory, including strongholds where the ruling party had scored more than double Tisza’s vote share just two years earlier. With a record turnout and a final result of two-thirds of seats, the night cemented the most dramatic realignment in Hungarian politics in a generation, closing a chapter that had defined the country’s political landscape since 2010.
Shipping Through the Strait of Hormuz
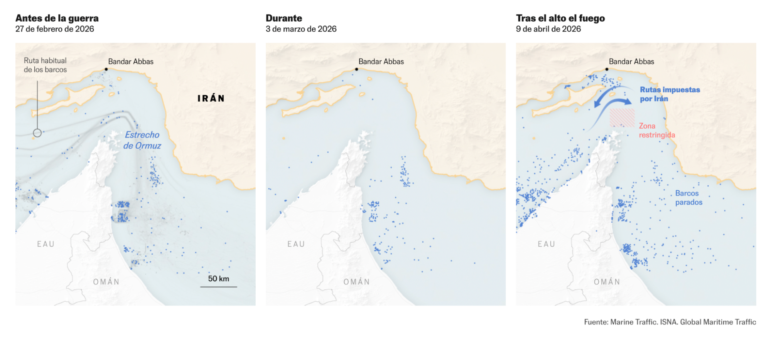
Image: Screenshot, El País
El País looked at how the Iran conflict has affected shipping in the Strait of Hormuz, using satellite imagery from Sentinel-2 and AIS tracking data from MarineTraffic, Kpler, and Bloomberg to document how the Iran war brought one of the world’s busiest waterways to a near-standstill in the weeks preceding April 8, when the US and Iran agreed to a two-week ceasefire. (After a round of failed negotiations in Pakistan days later — in which the US had hoped to persuade Tehran to reopen the Strait — the Trump administration announced a naval blockade, putting the ceasefire in doubt, although the situation remains fluid.) During the conflict, around 190 tankers carrying crude, diesel, and kerosene spent more than six weeks stranded in the Persian Gulf, and around 20,000 sailors were also trapped, according to the International Transport Workers’ Federation. Annotated satellite images taken on April 7 showed tankers queued on both sides of the Strait, while an annotated map illustrated the new entry and exit corridors Iran imposed. A daily bar chart of crossings tracked how traffic collapsed from roughly 140 ships a day before the war to single digits, with only 262 crossings recorded during the conflict compared to roughly 700 in a normal week.
Mapping Three Years of the Sudan War
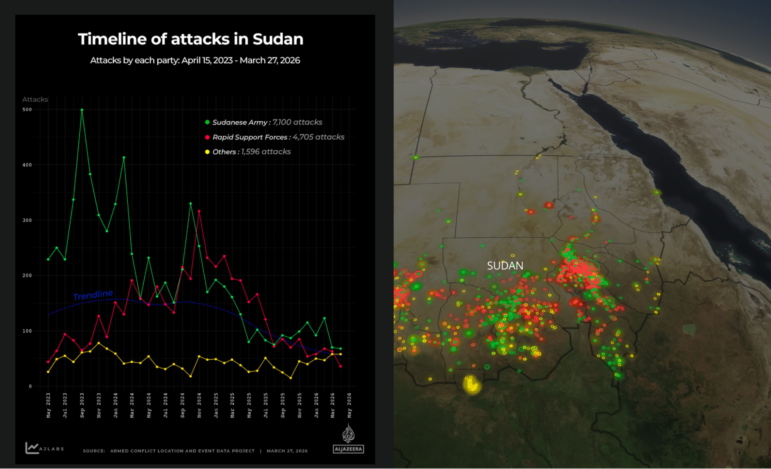
Image: Screenshot, Al Jazeera
Al Jazeera marked the third anniversary of Sudan’s civil war with a data-driven breakdown of the conflict’s human toll, drawing on Armed Conflict Location and Event Data (ACLED) to document more than 13,400 recorded attacks since April 2023, an average of 12 each day, that have killed more than 50,000 people and displaced 14 million. Animated control maps superimposed onto a scrolling breakdown of attacks by actor traced how the fighting between the Sudanese Armed Forces and the paramilitary Rapid Support Forces (RSF) has reshaped the country, leaving Sudan effectively split in two, with the army dominating the east and the RSF entrenched across Darfur and Kordofan. Khartoum alone accounted for 42% of all recorded violence, while North Darfur recorded the highest death toll at around 15,000. Woven throughout were firsthand accounts from residents of the 10 most heavily attacked regions. (Editor’s Note: This column’s author also works for Al Jazeera, so this selection was independently reviewed and approved by GIJN’s editorial team.)
Rise in ICE Child Detentions Under Trump
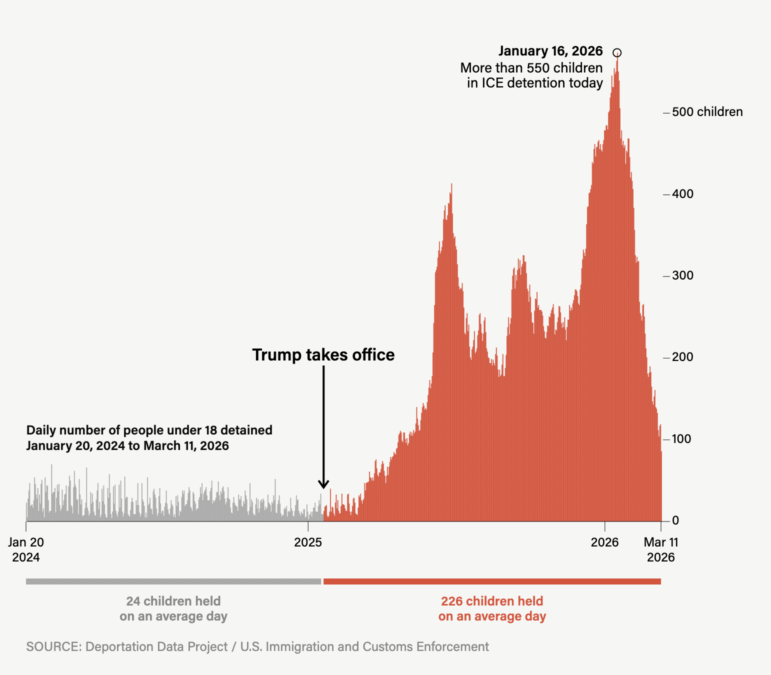
Image: Screenshot, The Marshall Project
The number of children detained daily by US Immigration and Customs Enforcement, or ICE, rose from an average of 24 under former President Joe Biden to 226 under President Donald Trump after he reinstated family detention. The Marshall Project used newly released ICE data, obtained via the Deportation Data Project, to visualize a time-series bar chart showing child detentions climbing sharply soon after the start of Trump’s second term, peaking above 550 in January 2026. The analysis also found that more than 1,600 children were held beyond the 20-day legal limit, often in poor conditions with inadequate access to medical care, food, and education, with medical experts warning that prolonged detention increases the risk of long-term mental health damage. Findings also revealed that since Trump took office, some 3,600 children have been deported from detention facilities, while more than 1,500 were released.
Looking Back at Hong Kong’s Fire Tragedy
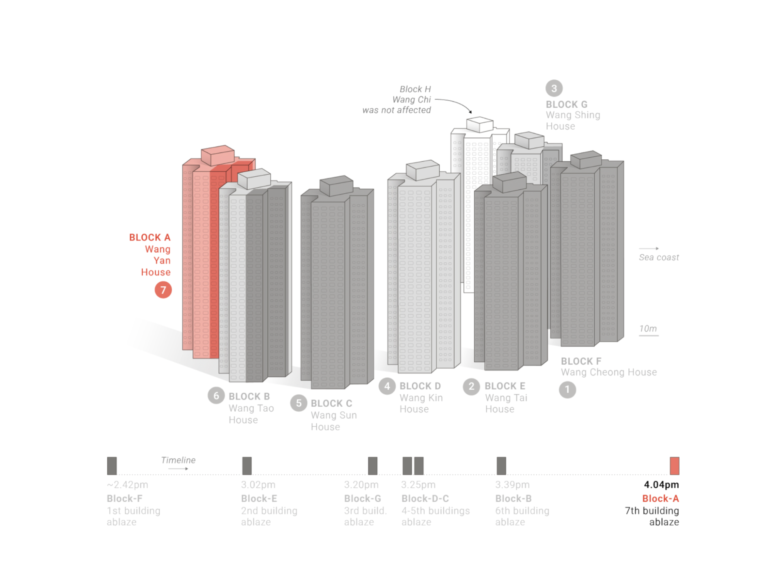
Image: Screenshot, South China Morning Post
Using more than one million files from a judge-led inquiry, the South China Morning Post set out to examine the causes and consequences of Hong Kong’s deadliest fire in more than 70 years. The blaze on November 26 tore through Wang Fuk Court, a subsidized housing complex in the Tai Po district with eight 31-story towers housing over 4,600 residents. The inquiry revealed that compounding failures, including combustible scaffolding mesh and removed fireproof windows, led to a “complete failure of fire safety measures.” Combining 3D illustrations of the complex with a minute-by-minute timeline, the piece traced how the fire started and spread from block to block, with 924 of 1,736 flats ultimately damaged. Transcripts of emergency calls — some from residents who did not survive — revealed how long people waited for help, while human figure illustrations were used to map casualties by block, and schematic illustrations showed which escape routes residents used, including lifts and staircases.
Earth’s Increasingly Crowded Orbit
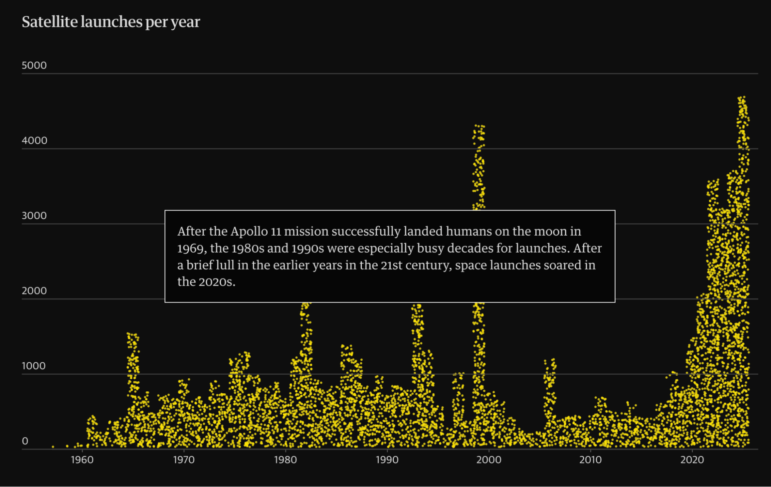
Image: Screenshot, the Guardian
Earth’s orbit has gone from empty to dangerously crowded in the space of less than 70 years. The Guardian produced a scrollytelling 3D globe to track roughly 32,000 objects now circling the planet, accumulated decade by decade since the launch of the first satellite, Sputnik, in 1957. Drawing on Space-Track.org, CelesTrak, and the personal catalog of astrophysicist Jonathan McDowell, the piece animated the growth of objects, revealing how the space race has shifted from public programs to the proliferation of private launches. A dot matrix chart was used to break down what is actually in space and who put it up there, revealing that the US has launched 49% of total orbital objects in the 2020s alone as SpaceX’s mega-constellations transformed the pace of launches. The visualization also captures how many active satellites, defunct spacecraft, and fragments of space junk are floating around. McDowell warned that if satellites were to collide, a cascading chain reaction could generate a debris field so dense it would make space effectively inaccessible for generations.
Battle for Control of the Arctic
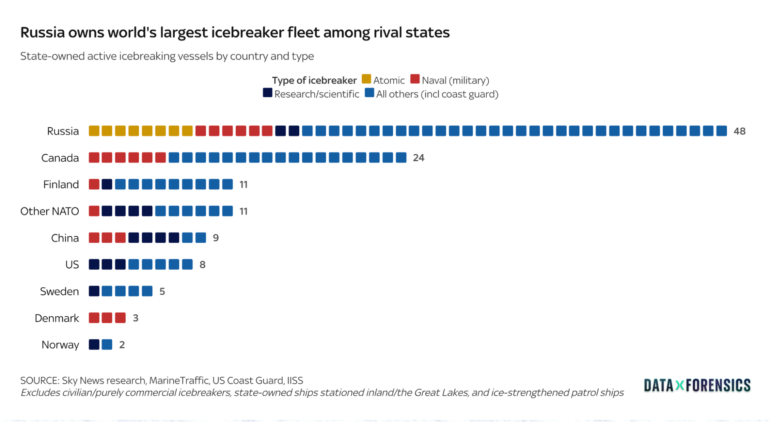
Image: Screenshot, Sky News
From inside a bunker in a Norwegian mountain, Sky News investigated the growing strategic interest in Arctic waters, using vessel tracking data to map icebreaker movements across the polar region. The Data and Forensics unit traced the 23-day route of Norway’s sole icebreaker, the Kronprins Haakon, around Svalbard in January. Russia, the story pointed out, operates 48 state-owned icebreakers, eight of them nuclear-powered — a capability far beyond any other country in the world — while the US has just eight icebreakers in total. A base comparison map showed that while NATO and Russian military installations in the Arctic are roughly equal in number, around half of the Arctic coastline — 24,000 kilometers (14,913 miles) — is Russian territory. The investigation also revealed that the number of Arctic military exercises doubled in 2025 compared to the prior four-year average, according to data from the Center for Strategic and International Studies, and without its partnership with Canada, the US would lose access to over 80% of its most northerly radar network under NORAD’s North Warning System.
Future of Family-Owned Firms
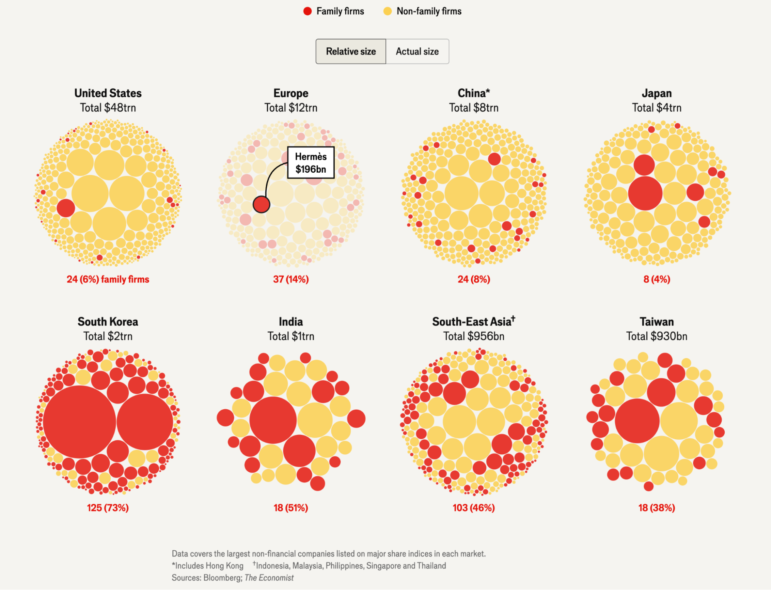
Image: Screenshot, The Economist
Family firms control roughly two-thirds of businesses and GDP worldwide, but an aging generation of founders is about to hand over the keys, and many have no plan. The Economist analyzed 1,600 listed non-financial companies across major stock indices in the US, Europe, and Asia, defining family firms as those where a clan holds at least 20% of shares or voting rights and has seen at least one generational handover. Using packed bubble charts, it found that around a quarter are family-controlled — one in three in Asia, one in seven in Europe, and one in 16 in the US — and that despite their dominance, such firms produced broadly similar long-term shareholder returns as non-family peers. According to interviews conducted as part of the article, the strengths of family firms lie in relationship networks passed down and a long-term outlook that can breed resilience.
World’s Leading Causes of Death
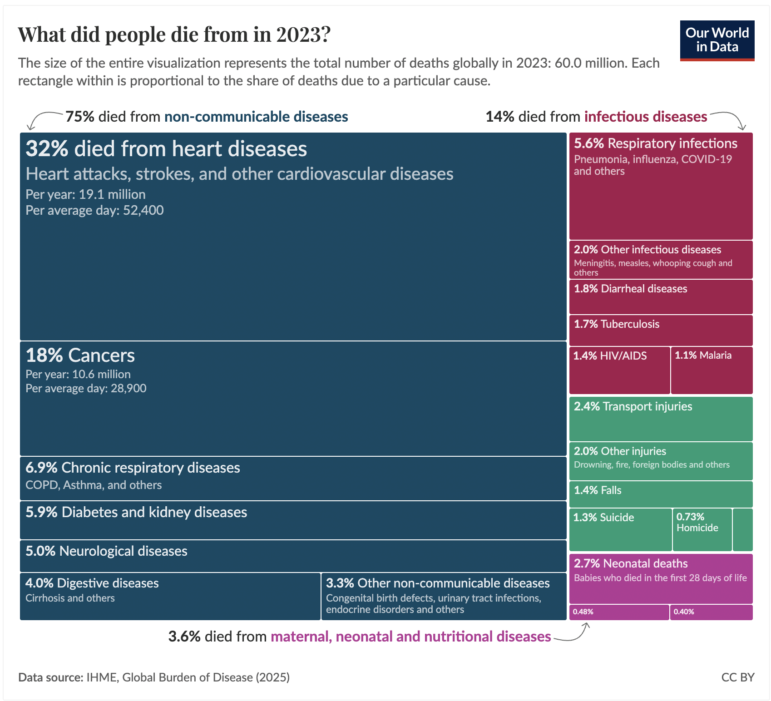
Image: Screenshot, Our World in Data
Heart disease kills one in three people globally, and in low-income countries, one in 10 deaths is a newborn or a mother. Our World in Data built an interactive treemap using four decades of data from the Institute for Health Metrics and Evaluation’s Global Burden of Disease study, letting readers filter by country, age, sex, and year to explore how radically causes of death differ across income levels. The treemaps reveal that in 2023, three-quarters of global deaths were caused by non-communicable diseases such as cancer, while infectious diseases caused 14% of deaths, 7% died from injuries, and nearly 4% of deaths were among mothers and babies. In high-income countries, 88% of deaths come from non-communicable diseases, and in low-income countries, deaths from infections, injuries, and child and maternal mortality are far higher.
Hanna Duggal is the writer of GIJN’s fortnightly Top 10 in Data Journalism column, and a data journalist at AJ Labs, the data, visual storytelling, and experiments team of Al Jazeera. She has reported on issues such as policing, surveillance, and protests using data, and reported for GIJN on data journalism in the Middle East, investigating algorithms on TikTok, and on using data to investigate tribal lands in the US.

Reporter’s Guide to Investigating Cryptocurrency

Tipsheet on Partnering with Civil Society Organizations and Non-Governmental Organizations

AI Accountability Reporting Guide

Guide to Mapping Analysis Using QGIS
Global Data Center Energy Use, US Strike on Iran School, Russia’s Security Service Leaks, Portugal’s Ancient Trees
Late World Cup Goals, Foreigners Fueling Sudan’s War, Venezuela’s Deadly Double Earthquake, and Fatal SUV Blindspots

Visualizing a Trillion Dollars, India’s Warming Cities, Russian Mercenaries at Sea, and World Cup Player Physiques
‘Super’ El Niño Threat, Myanmar Villages Razed, California’s Billionaire Tax Bill, and South Africa’s Murder Rate

This work is licensed under a Creative Commons Attribution-NoDerivatives 4.0 International License
Republish our articles for free, online or in print, under a Creative Commons license.
Republish this article
This work is licensed under a Creative Commons Attribution-NoDerivatives 4.0 International License
Read Next
Data Journalism Top 10
Global Data Center Energy Use, US Strike on Iran School, Russia’s Security Service Leaks, Portugal’s Ancient Trees
This latest Top 10 in Data Journalism column also highlights rising drug-related deaths in Berlin, heatwave fatalities in Europe, and Hong Kong’s rapidly aging population.
Data Journalism Top 10
Late World Cup Goals, Foreigners Fueling Sudan’s War, Venezuela’s Deadly Double Earthquake, and Fatal SUV Blindspots
Also highlighting the civilian casualties of the first 40 days of the US-Iran war, why carbon capture won’t solve climate change, and the 370,000-plus prisoners still awaiting trial in India.
Data Journalism Top 10
Visualizing a Trillion Dollars, India’s Warming Cities, Russian Mercenaries at Sea, and World Cup Player Physiques
Also highlighting how films portray Ukrainians, increasing tree cover in Spain, and how couples meet.
Data Journalism Top 10
‘Super’ El Niño Threat, Myanmar Villages Razed, California’s Billionaire Tax Bill, and South Africa’s Murder Rate
Also highlighting exploitation of journalists in Egypt, Argentina’s returning World Cup squad, and the strain on Singapore’s aging caregivers.