Register for #GIJC25
November 20, 2025 • 09:00
-
day
days
-
hour
hours
-
min
mins
-
sec
secs

Accessibility Settings

color options

monochrome muted color dark

reading tools

isolation ruler

Posts

707 posts

Data Journalism

Data Journalism Top 10: Musical Taste by Politics, Podcasts, Polling Problems, COVID Tweet Analysis

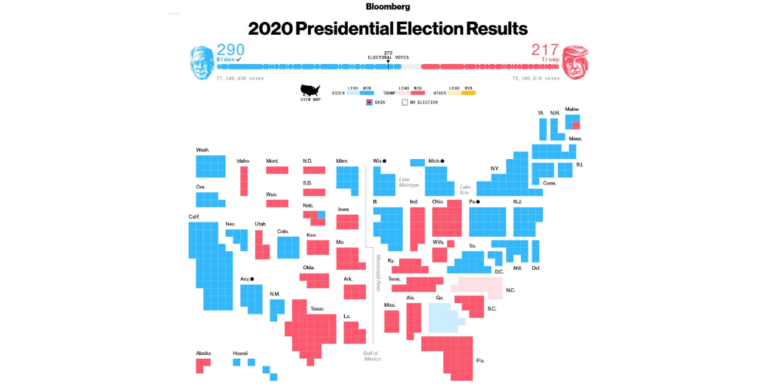
The US presidential election dominated the Twitter chat waves last week. Our NodeXL #ddj mapping from November 2 to 8 found data journalists sharing live election results trackers by Bloomberg, The Washington Post, and The New York Times, while The Atlantic and Slate weighed in on the problems of polling. Elsewhere open source platform Mapbox is organizing an election mapping contest, and Lazer Lab created a dashboard to explore 29 million tweets related to COVID-19 shared by over half a million Americans.

Data Journalism

Data Journalism Top 10: Animating COVID Masks, Mapping US Campaign Cash, Homeless Arrests, Berlin Protests

Research shows that masks are an essential defense against the coronavirus. Our NodeXL #ddj mapping from October 26 to November 1 finds The New York Times using animation and augmented reality to show just how masks work to filter and trap air particles that may carry the virus. This edition also includes several pieces on the United States presidential election: FiveThirtyEight founder Nate Silver talks to Vox about polling errors and uncertainties, freelance journalist Betsy Mason explains common shortcomings of US election maps, and NYT analyzed more than 25 million donations to Trump and Biden’s presidential campaigns.

GIJN Webinar — Investigating Sexual Abuse: Reporting Tips & Tools

In this global GIJN webinar we bring together three journalists from France, China and India who have substantial experience in investigating cases of sexual abuse. They will share their strategies and reporting tips, ranging from collecting evidence to how to deal with survivors and their families during and after the investigation.

Data Journalism

Data Journalism Top 10: Ranking Halloween Candy, Formula 1, Canadian Prisons, COVID-19 Indoors

Gearing up for Halloween? You’ll want to refer to our NodeXL #ddj mapping from October 19 to 25. We found FiveThirtyEight’s ultimate Halloween candy ranking from the archives to please the palates of finicky trick-or-treaters. This edition also includes The Economist’s mathematical model to determine whether Formula 1 racing success depends on its driver or the car engineer; The Globe and Mail examines bias in Canada’s prison system; and El Pais looks into how to reduce the probability of COVID-19 transmissions indoors.

Data Journalism

Data Journalism Top 10: Visualizing Hurricanes, Predicting Wildfires, Social Media Algorithms, Trump Loyalty Index

How does climate change increase the likelihood of weather extremes? Our NodeXL #ddj mapping from October 12 to 18 finds ProPublica examining how the warming global climate exacerbates wildfire activity, and designer Will Chase visualizing some of the most destructive hurricanes with an interactive wheel graphic. The Financial Times is summarizing key trends of the pandemic using charts, maps, and graphics, while The Markup announced its latest project looking into the black box algorithms of social media platforms.

GIJN Webinar — Investigating Autocracy: Strategies and Tips

Authoritarianism is on the rise around the world, from failing democracies to despotic regimes. In this global GIJN webinar, we bring together four extraordinary journalists from Russia, Egypt, South Africa, and the Philippines to share strategies for staying effective and true to the journalism profession’s highest standards.

Data Journalism

Data Journalism Top 10: A Stunning COVID Data Blunder, Beautiful News, Arctic Fires, Eviction Abuses, Isolating Students

The advancement of technology and availability of complex data tools has been a real boon to society, but utilizing the wrong tools for the job can have dire consequences. Our NodeXL #ddj mapping from October 5 to 11 finds British media organizations the BBC and the Guardian reporting on a blunder by the English national health authority: it used the wrong Excel file format to store data, resulting in the loss of thousands of COVID-19 test data results. Meanwhile, German television news program ZDF heute highlighted how the Arctic has reached record high temperatures this year, DCist and Spotlight DC examined problems in the process of evictions, and we find Information is Beautiful offering a daily feed of uplifting news among the gloom of 2020’s news cycle.

Data Journalism

Data Journalism Top 10: Black Voter Suppression, K-Pop, Data Privacy Rights, and Global Coronavirus Deaths

Personal data is big business, and not only for private firms. Our NodeXL #ddj mapping from September 21 to 27 finds a number of troubling investigations: Channel 4 News revealed that Donald Trump’s 2016 presidential campaign used personal data from Facebook and Cambridge Analytica to deter Black voters from casting their ballot; Consumer Reports found that companies were making it difficult for people to opt out of having their data sold despite a landmark California law that protects individual data rights; and Noteworthy and The Business Post highlighted a concerning lack of clear regulation surrounding access to, and use of, genetic and patient data by private firms.

Investigating the Police: Reporting Tips & Tools

In this global GIJN webinar, “Investigating the Police: Reporting Tips and Tools,” co-organized with the African Investigative Journalism Conference, we bring together four experienced journalists: two from Africa and two from outside the continent, who have investigated law enforcement. They will share their experience and reporting techniques ranging from source development to forensic analysis.