
Nature examined the drastic cuts to US science research pushed by the Trump White House. Image, Screenshot, Nature
US Science Research Cuts, Shadow Fuel from Iran, Trump’s Crypto Wealth, and Mapping Below Antarctica’s Ice
It’s been one year since Donald Trump returned to the White House for a second term as US president, and data journalists have been busy charting the impact, with several Trump-focused stories featured in this week’s roundup. Nature examined how the administration slashed funding for US research programs, while Bloomberg mapped the Trump family’s lucrative crypto ventures, and the Guardian explored how the president’s ambitions for Greenland are revealing the potential for future Arctic trade. Our roundup of the Top 10 in Data Journalism considers stories from January 14 to 28, and also features a Reuters investigation into Iran’s secret shipments supporting Myanmar’s junta, Folha de S. Paulo’s analysis of Venezuelan migration into Brazil, De Tijd’s mapping of Flanders’ rapidly expanding EV charging network, and new research revealing what lies beneath Antarctica’s ice.
How the Trump’s White House Gutted US Science and Research
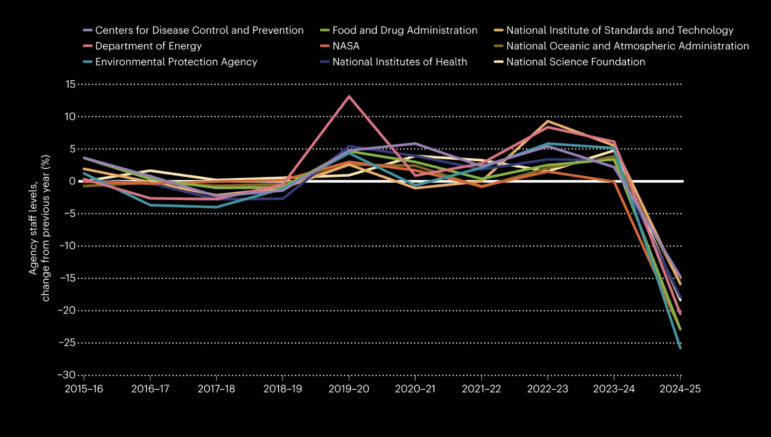
Image: Screenshot, Nature
A Nature analysis showed how, a year into Trump’s second term, US science research has been dramatically reshaped after funding cuts under the Trump administration. Combining data from the National Institutes of Health (NIH) and National Science Foundation (NSF) — two of the largest public supporters of scientific research in the country — Nature documented how more than 7,800 research grants were cancelled or suspended in 2025. Visualized in a treemap sized by grant budget and grouped by state, it revealed that institutions in New York City, particularly Columbia University, had the largest share of cancelled or frozen grants. A line chart displaying the percentage change in staff across various federal science agencies showed that 25,000 scientists and staff were fired or left, hitting the Environmental Protection Agency (EPA), NASA, and the Food and Drug Administration (FDA) hardest. The story added that further proposed budget cuts of 35% would slash research and development funding back to 1991 levels, squeezing the pipeline for future scientists and weakening federal research nationwide.
Iran’s Role in Myanmar’s Civil War
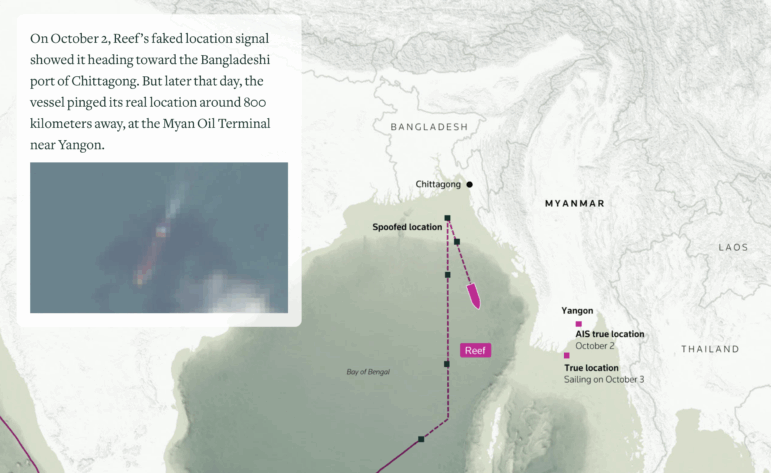
Image: Screenshot, Reuters
A Reuters investigation revealed that Iran has secretly supplied vast quantities of jet fuel and urea to Myanmar’s military, assisting the junta’s intensified bombing campaign against civilians. According to the story, from October 2024 to December 2025, Iranian tankers delivered approximately 175,000 tons of jet fuel in nine shipments, along with hundreds of thousands of tons of urea — a component used in munitions. In October 2025, strikes by the junta on the village of Vanha killed two students and injured 22 more, just days after one of the vessels had offloaded over 16,000 tons of jet fuel. These deliveries violate Western sanctions. Reuters mapped the ships’ movements using shipping documents and corroborated its findings with satellite imagery and analysis from geospatial data company SynMax Intelligence, tracking these vessels even when their AIS signals were disabled or deliberately obscured. The investigation found that two Iranian vessels — the Reef and its sister ship Noble — have consistently supplied Myanmar’s air force since the deliveries began, fuelling over 1,000 civilian attacks on targets across 15 months. While it is not confirmed whether the Vanha warplane was fueled by Iranian deliveries, shipping and satellite data show the junta’s air force has relied almost exclusively on Iranian imports for more than a year.
How Japan’s AI Data Center Boom Is Resuscitating Nuclear Power
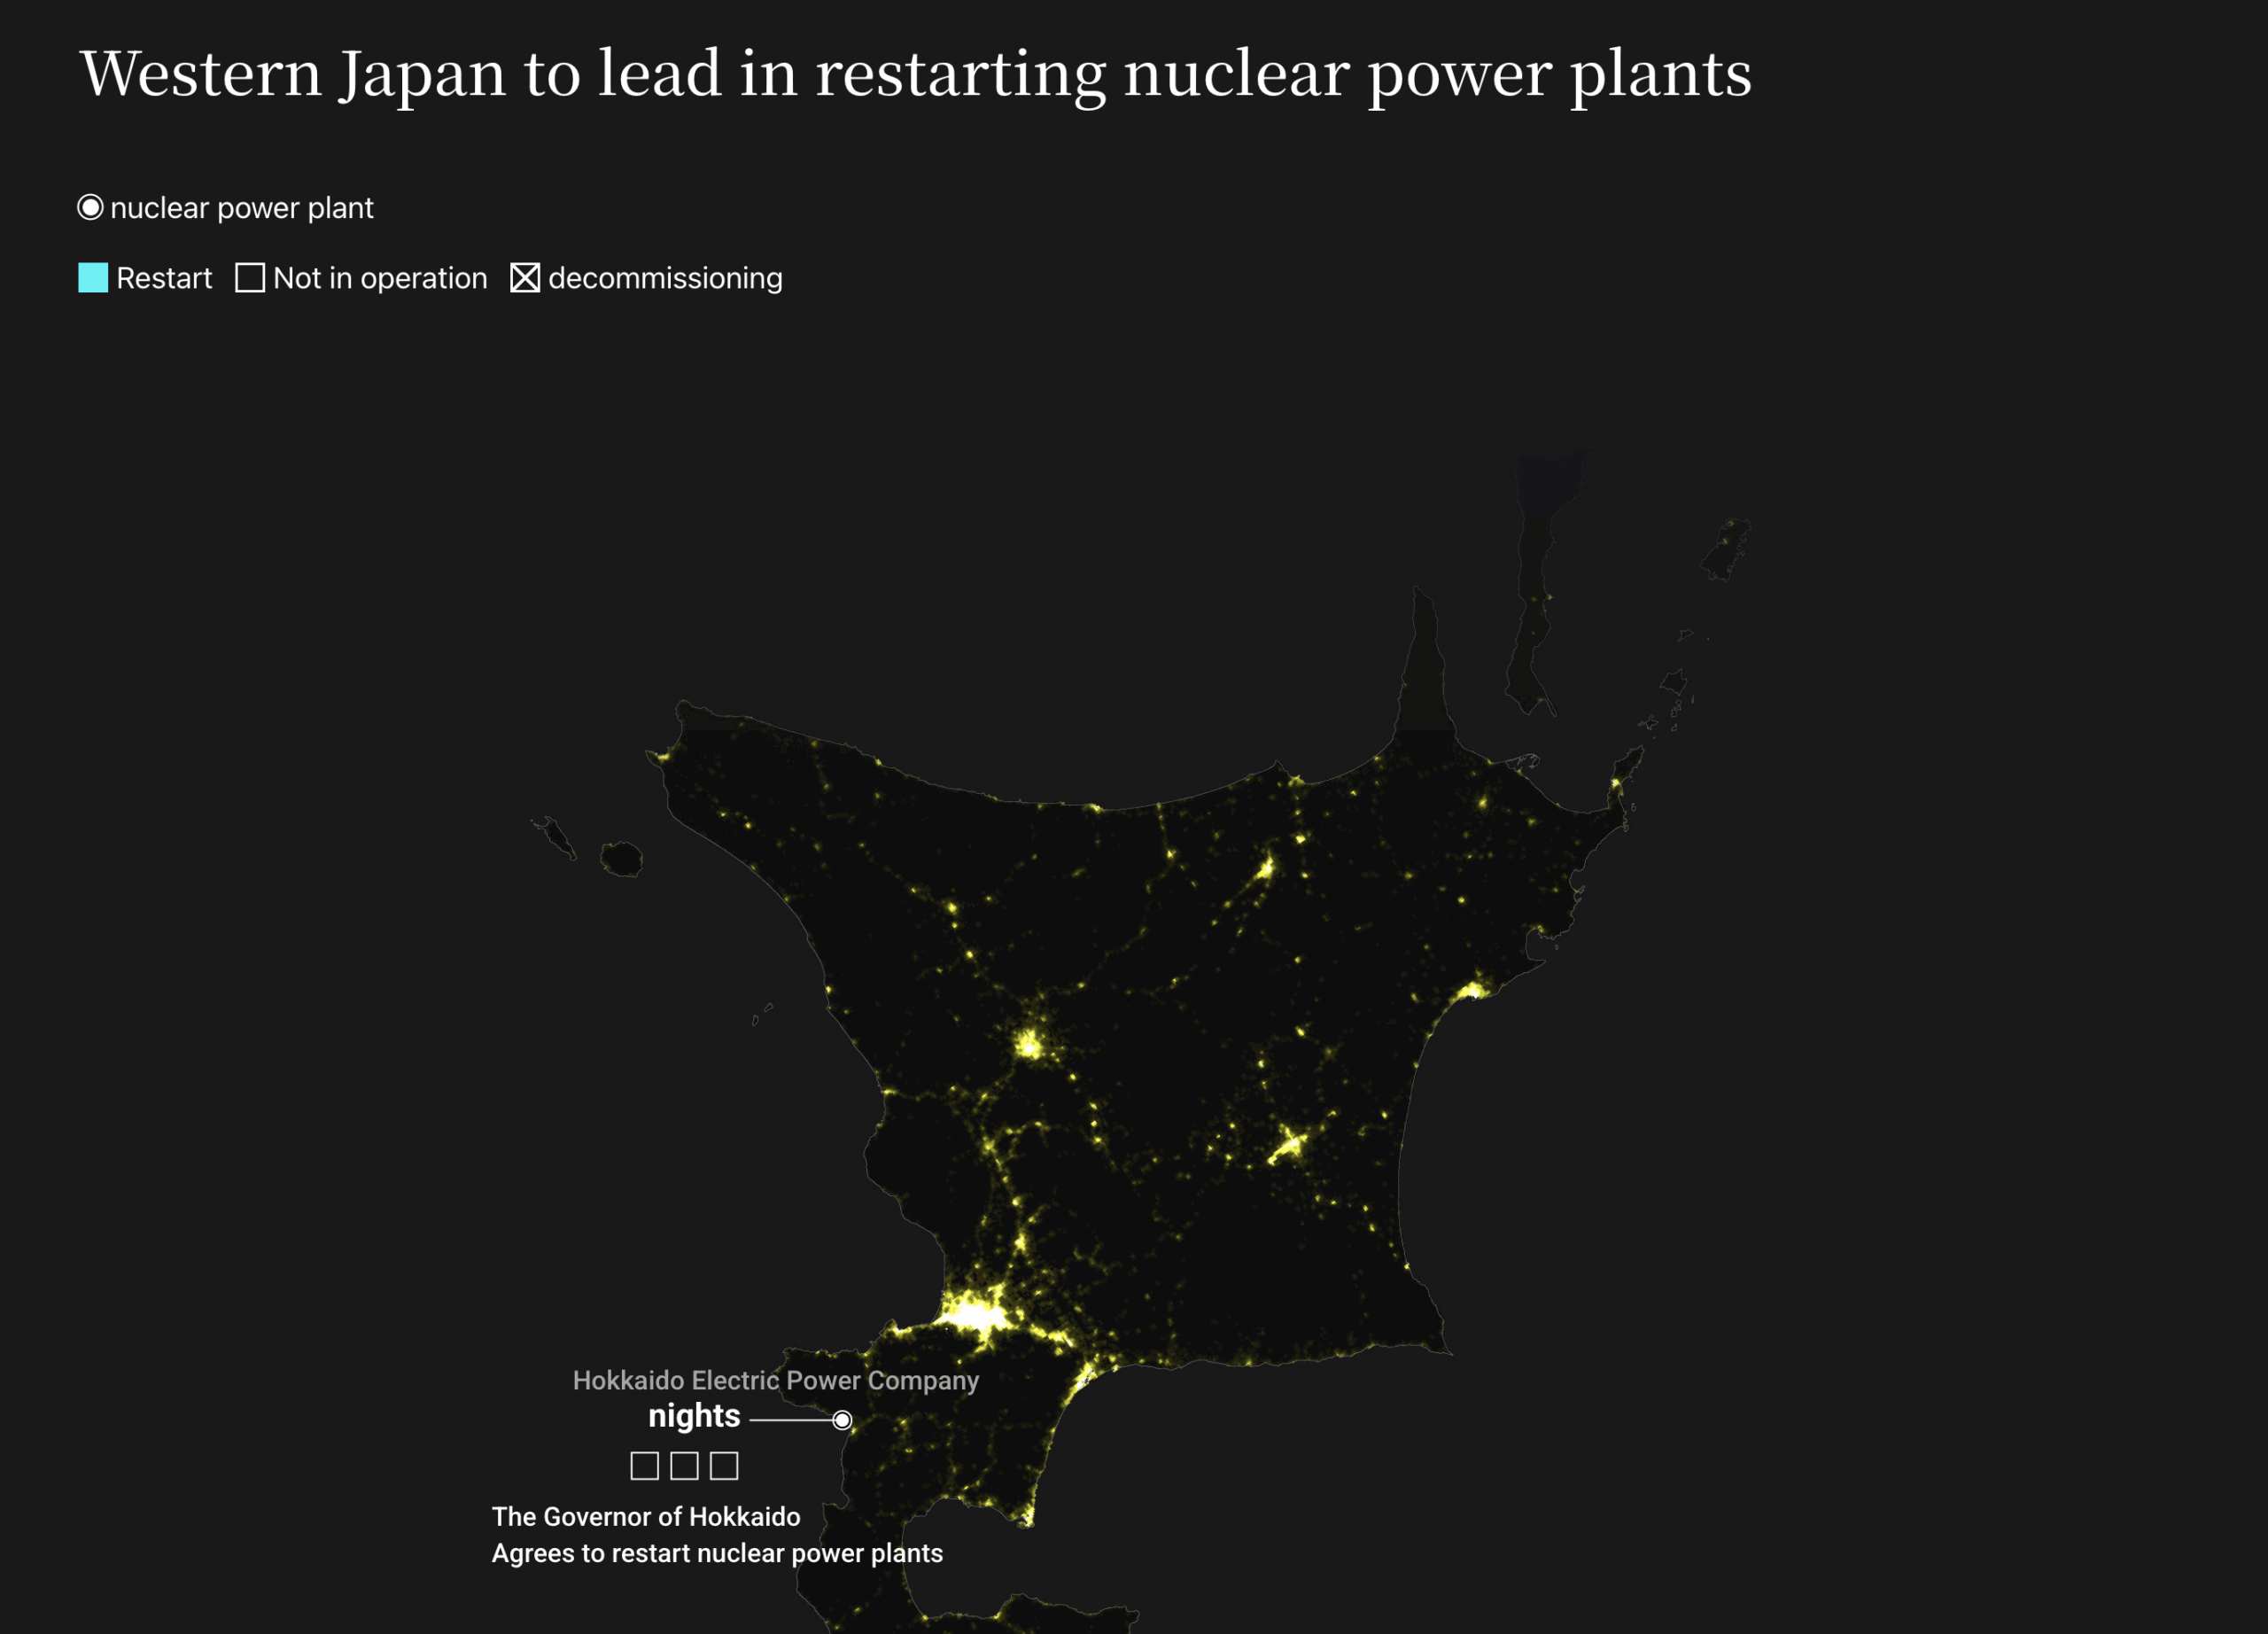
Image: Screenshot, Nikkei Vdata
Nikkei’s data team examined Japan’s shifting nuclear energy policy through the restart of Kashiwazaki-Kariwa Nuclear Power Plant Unit 6, which was shut down after the Fukushima accident in 2011, and amid rising electricity demand from AI-driven data centers. Using data from the Tokyo Electric Power Company (TEPCO) — which also ran the Fukushima Daiichi nuclear plant destroyed in the 2011 earthquake — and the Nuclear Regulation Authority, the story mapped all 36 nuclear plants by operational status, safety upgrades, and proximity to urban power demand. Visuals highlighted east-west disparities in operations, time-series trends in electricity generation since Fukushima, and projections showing nuclear’s share of Japan’s power mix rising to 20% by 2040. Paired with modeling of AI-related energy use, the analysis showed how restarting reactors such as Kashiwazaki-Kariwa is central to Japan’s carbon-free energy goals as offshore wind projects stall and fossil fuel costs rise. (As of January 22, the Kashiwazaki-Kariwa reactor was shut down again hours after restarting; it’s unclear when it will resume operations.)
Changing Face of Venezuelan Migration Into Brazil
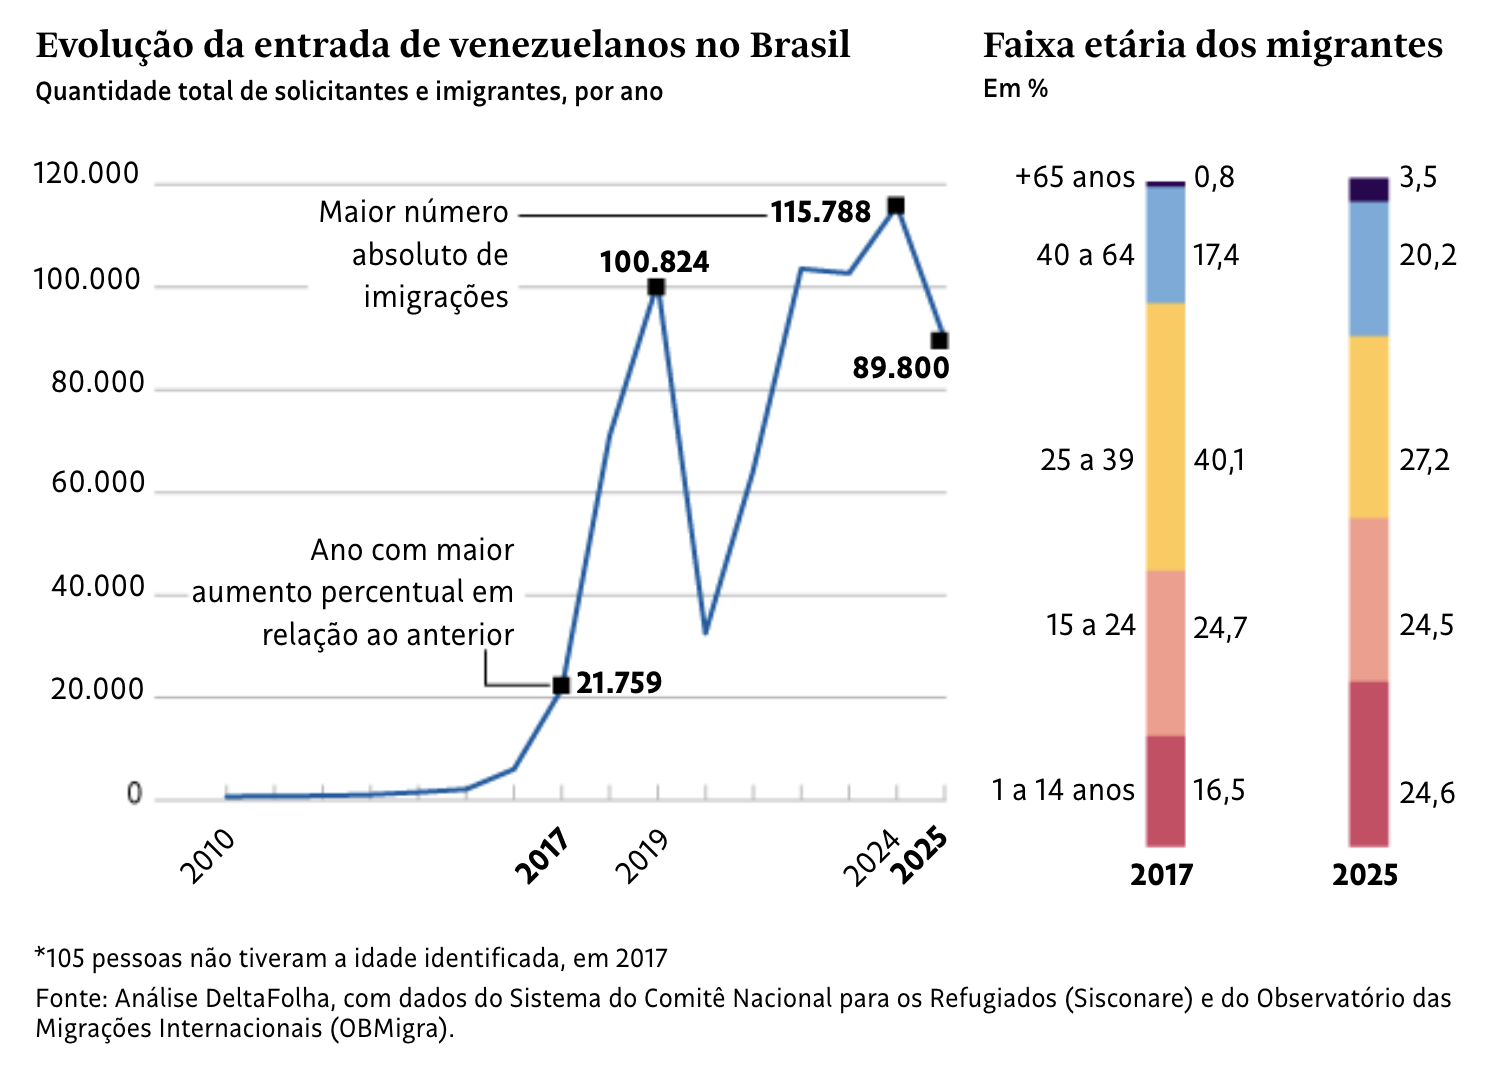
Image: Screenshot, Folha De S.Paulo
Using data from the National Committee for Refugees System and the Observatory of International Migration at the University of Brasília, an analysis by Folha showed that Venezuelan migration through Brazil has shifted from primarily individual journeys to family movements, with significant demographic changes underpinning the flow. The data revealed that while adults aged 25–39 remain the largest group, their share of total entries fell from 40 % in 2017 to 27 % in 2025, as arrivals of children and adolescents under 15 rose from 16 % to 25 % over the same period. The share of migrants aged 40-64 also increased, and in 2025, women outnumbered men. UNHCR displacement data show the country became a major route for Venezuelans between 2018 and 2022.
Mapping One of Spain’s Worst Train Accidents
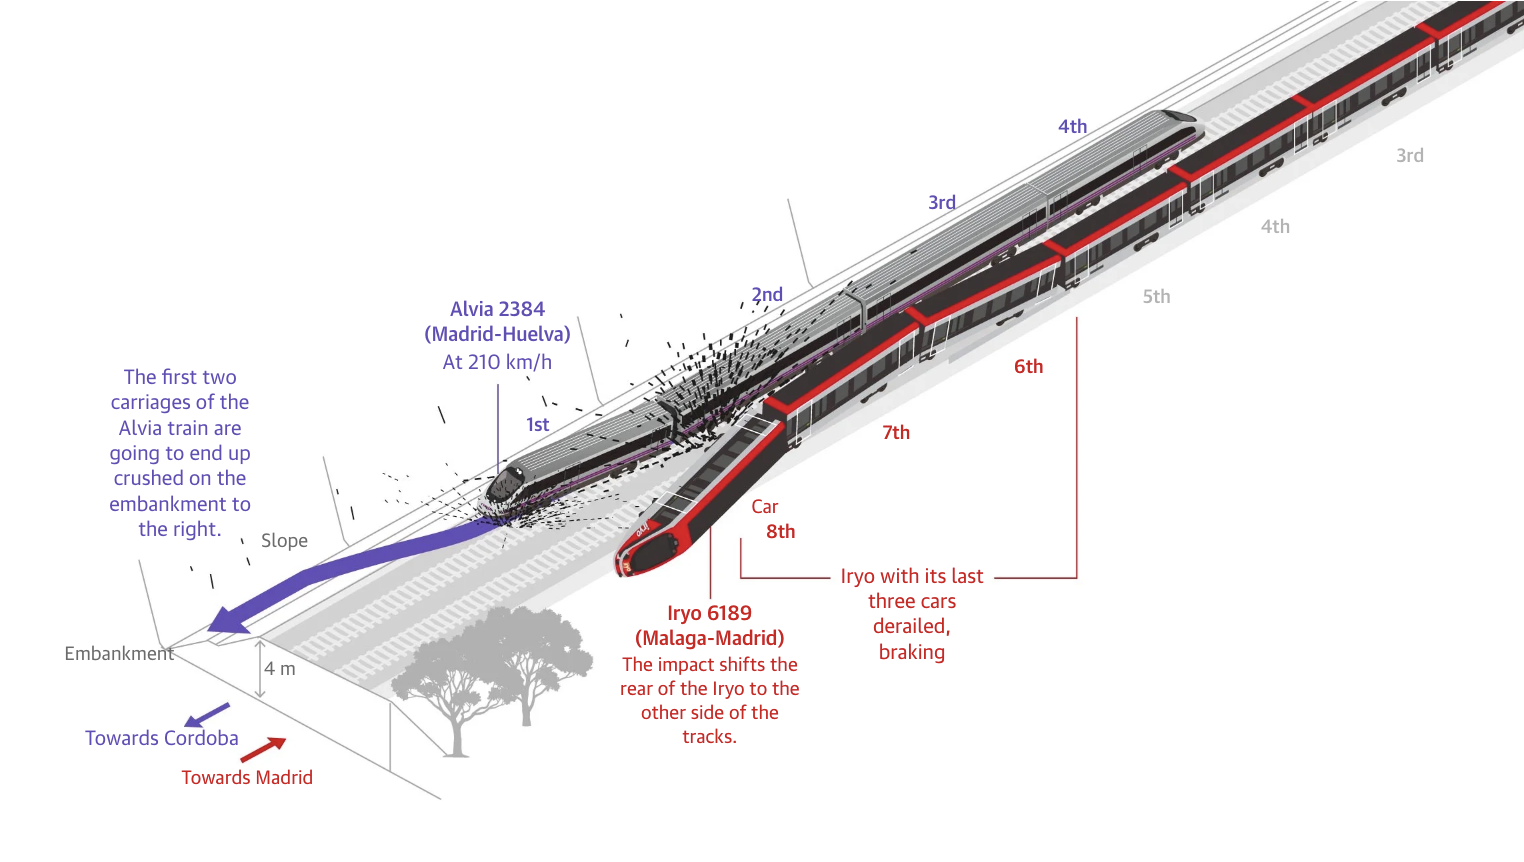
Image: Screenshot, Diario Sur
A collision between two high-speed trains near Adamuz, in Spain’s Córdoba province, killed 45 people and injured 152 after a derailment spilled into oncoming traffic on January 18. In a visual investigation, Diario SUR reconstructed how the Iryo 6189, traveling from Málaga to Madrid, derailed following a break in the outer rail, and how its last cars crossed into the adjacent line seconds before being struck by the Alvia 2384 from Madrid to Huelva. Using reports, track diagrams, satellite imagery, carriage layouts, and photographs of damaged rails and wheels, the analysis mapped the 500-meter zone between derailment and collision.
Wikipedia 25 Years On
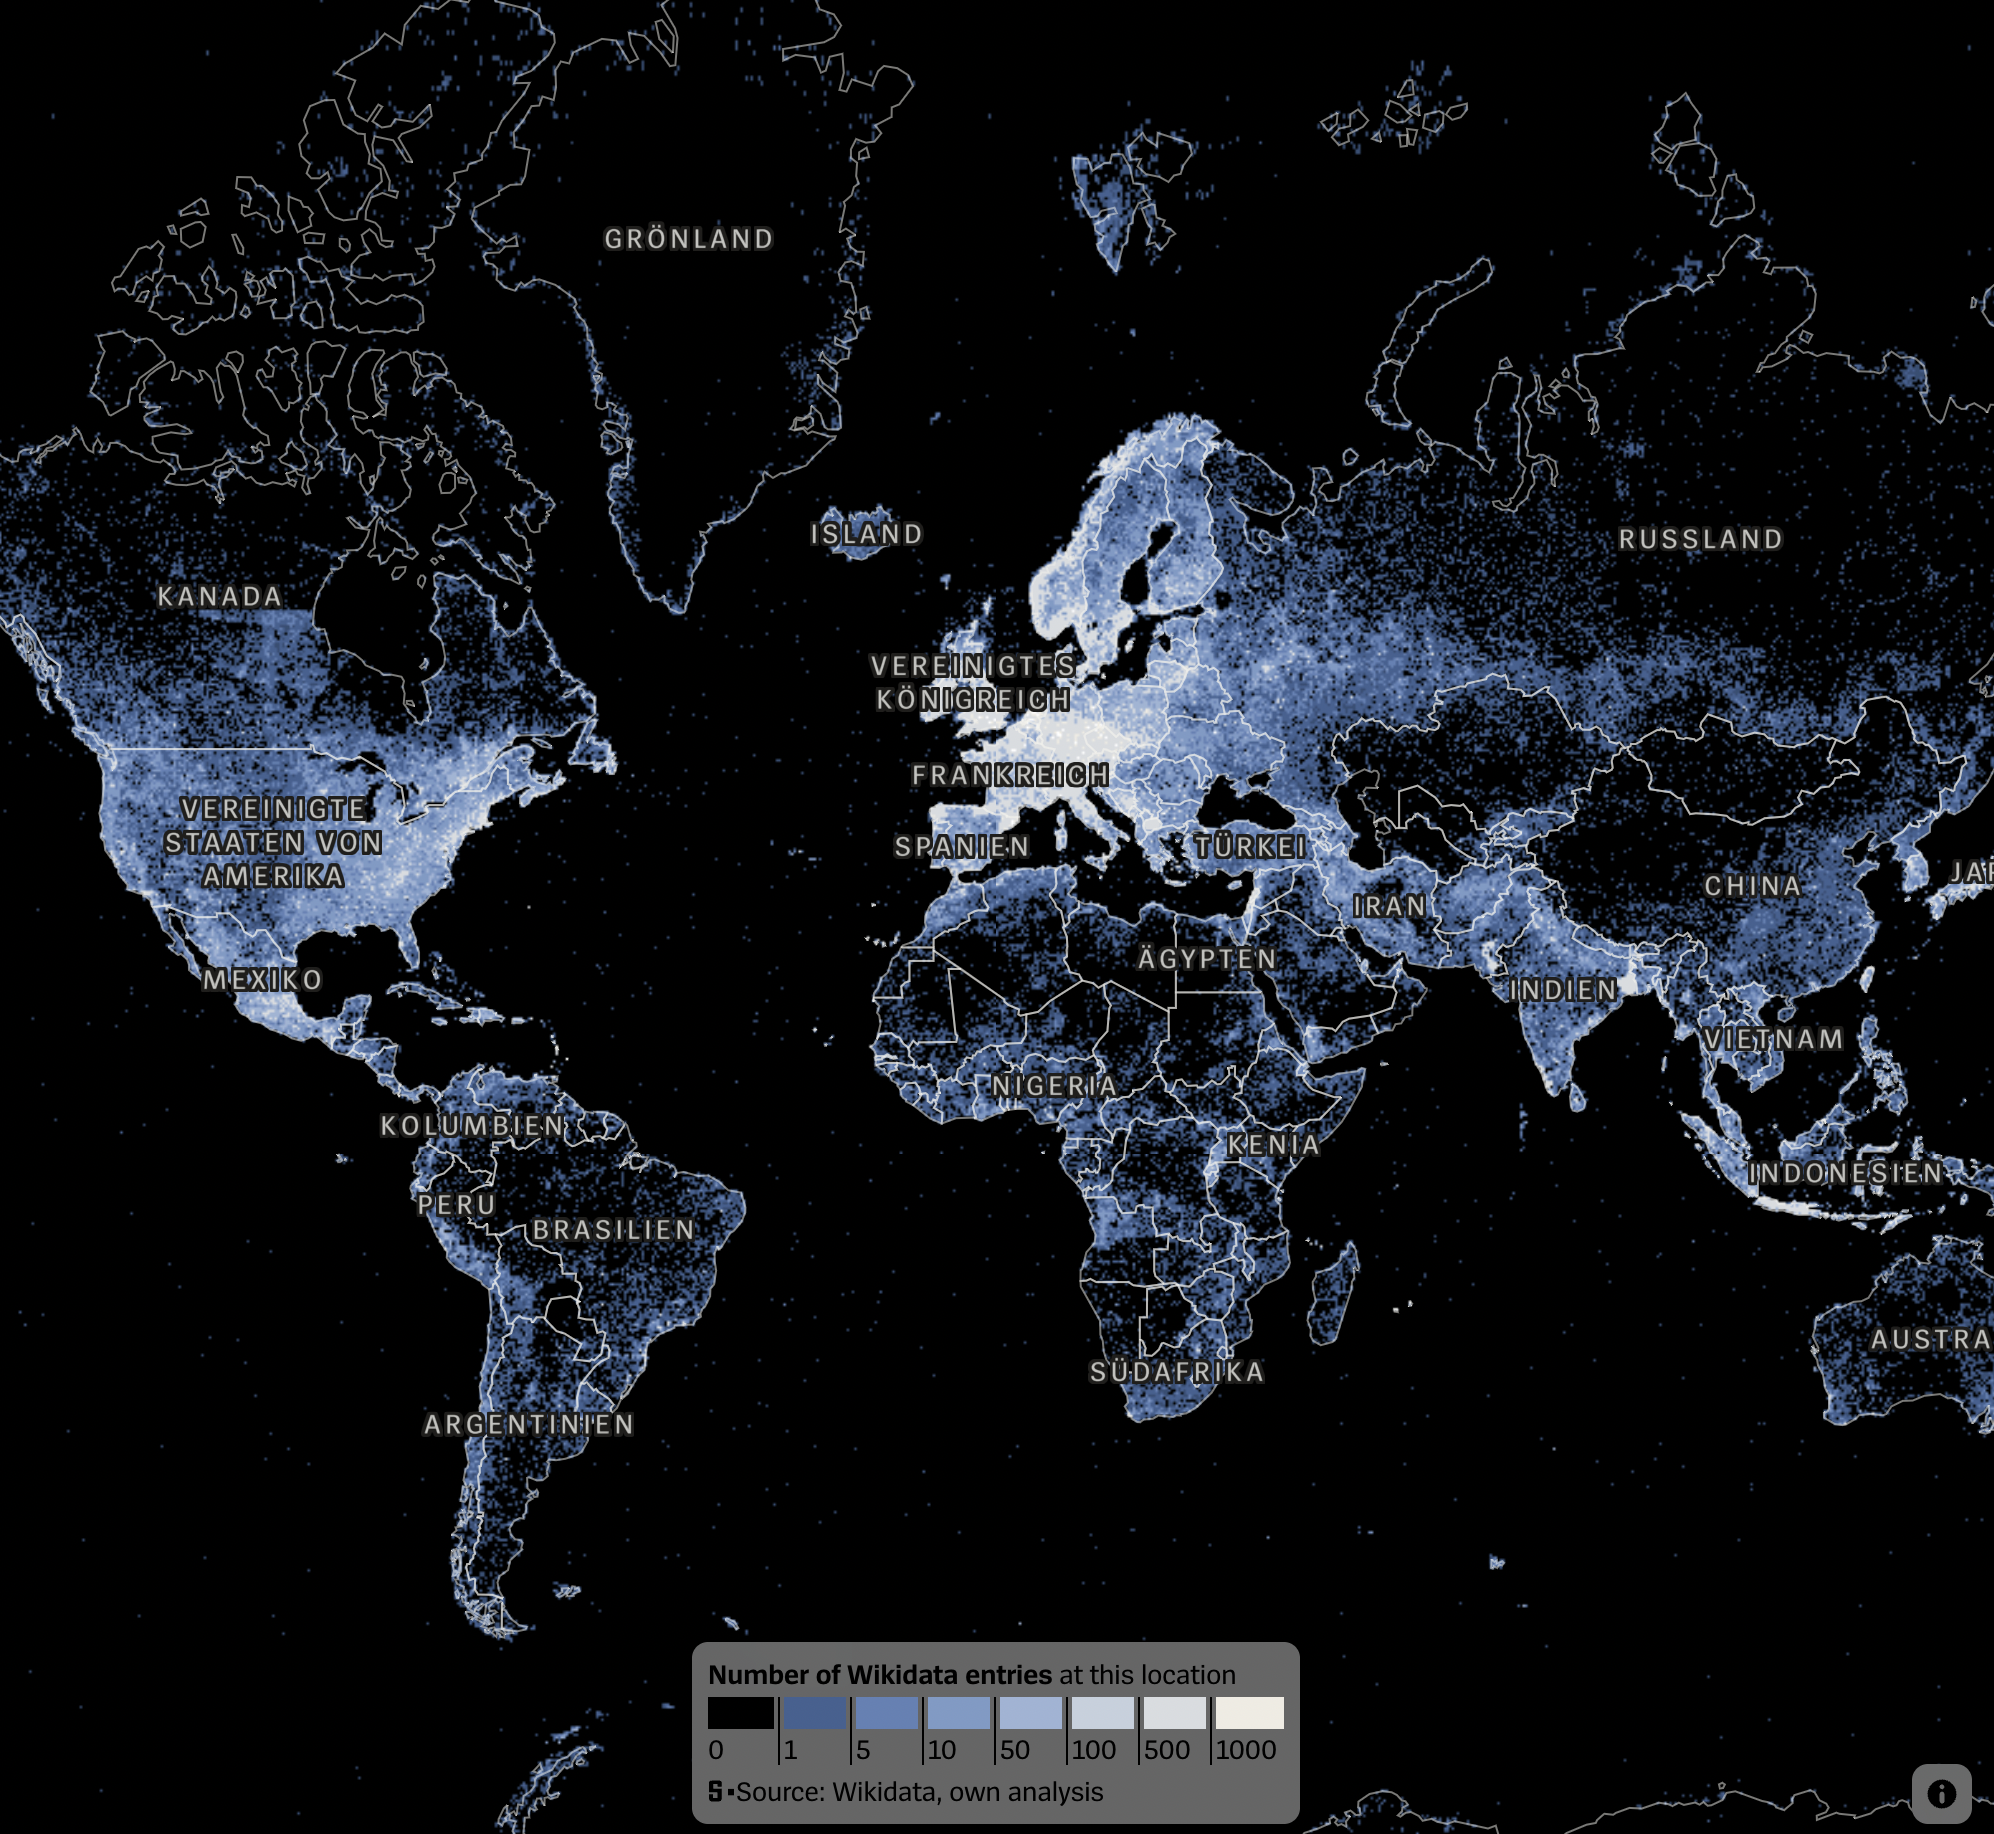
Image: Screenshot, Der Spiegel
Wikipedia, the online encyclopedia, is celebrating a major anniversary, with users contributing to the writing of Wiki pages for a quarter of a century, yet coverage is uneven across regions. Der Spiegel used Wikidata, the central database for all language editions, to map location-based entries worldwide, showing dense documentation in Germany, but major gaps in Africa, parts of Asia, and China due to limited internet access, volunteer availability, and political restrictions. The analysis also incorporated population density data from Copernicus’s Global Human Settlement dataset. Wikipedia’s openness allows anyone to reuse its content for AI, search engines, or research, but volunteer-driven contributions are shaping the distribution of knowledge globally.
Trump Dynasty’s Crypto Wealth
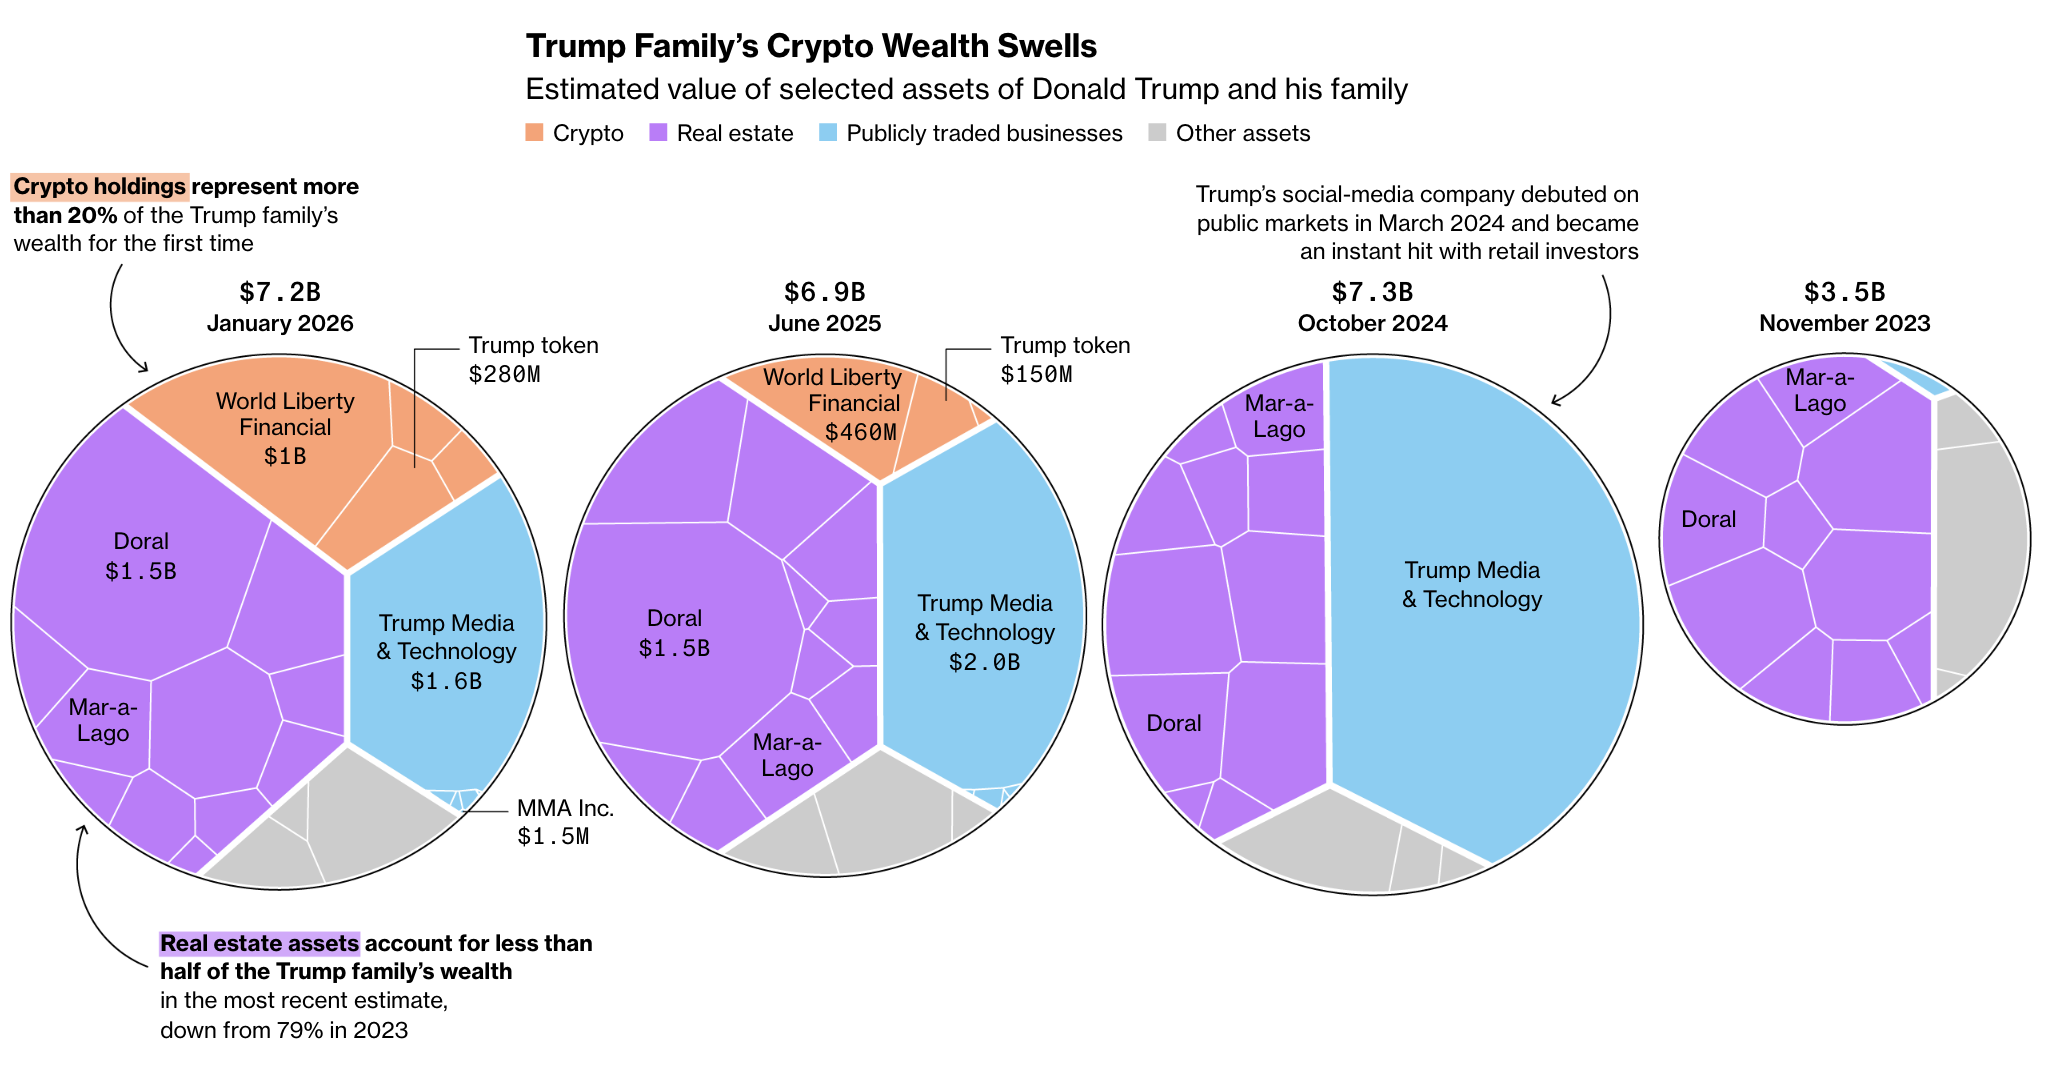
Image: Screenshot, Bloomberg
Drawing on its Billionaires Index, Bloomberg examined how the Trump family’s wealth expanded in the first year of his second term, combining reporting with analysis of crypto holdings, private ventures, and financial filings. Using Voronoi treemaps sized by total assets, the data shows how digital assets added US$1.4 billion to the family fortune, making up about one-fifth of the net worth. Journalists tracked three standout ventures: a crypto platform co-founded by Trump and his sons, a memecoin bearing his name, and American Bitcoin Corp, alongside transactions like World Liberty token sales and deals with Alt5 Sigma Corp. The family still holds US$3.8 billion in founder tokens, currently locked. Bloomberg also highlighted Donald Trump, Jr.’s role in 1789 Capital, a US$2 billion venture fund backing startups including SpaceX, showing how the family’s wealth now spans cryptocurrency, private equity, and high-tech investments.
Arctic Shipping Routes and Greenland’s Role
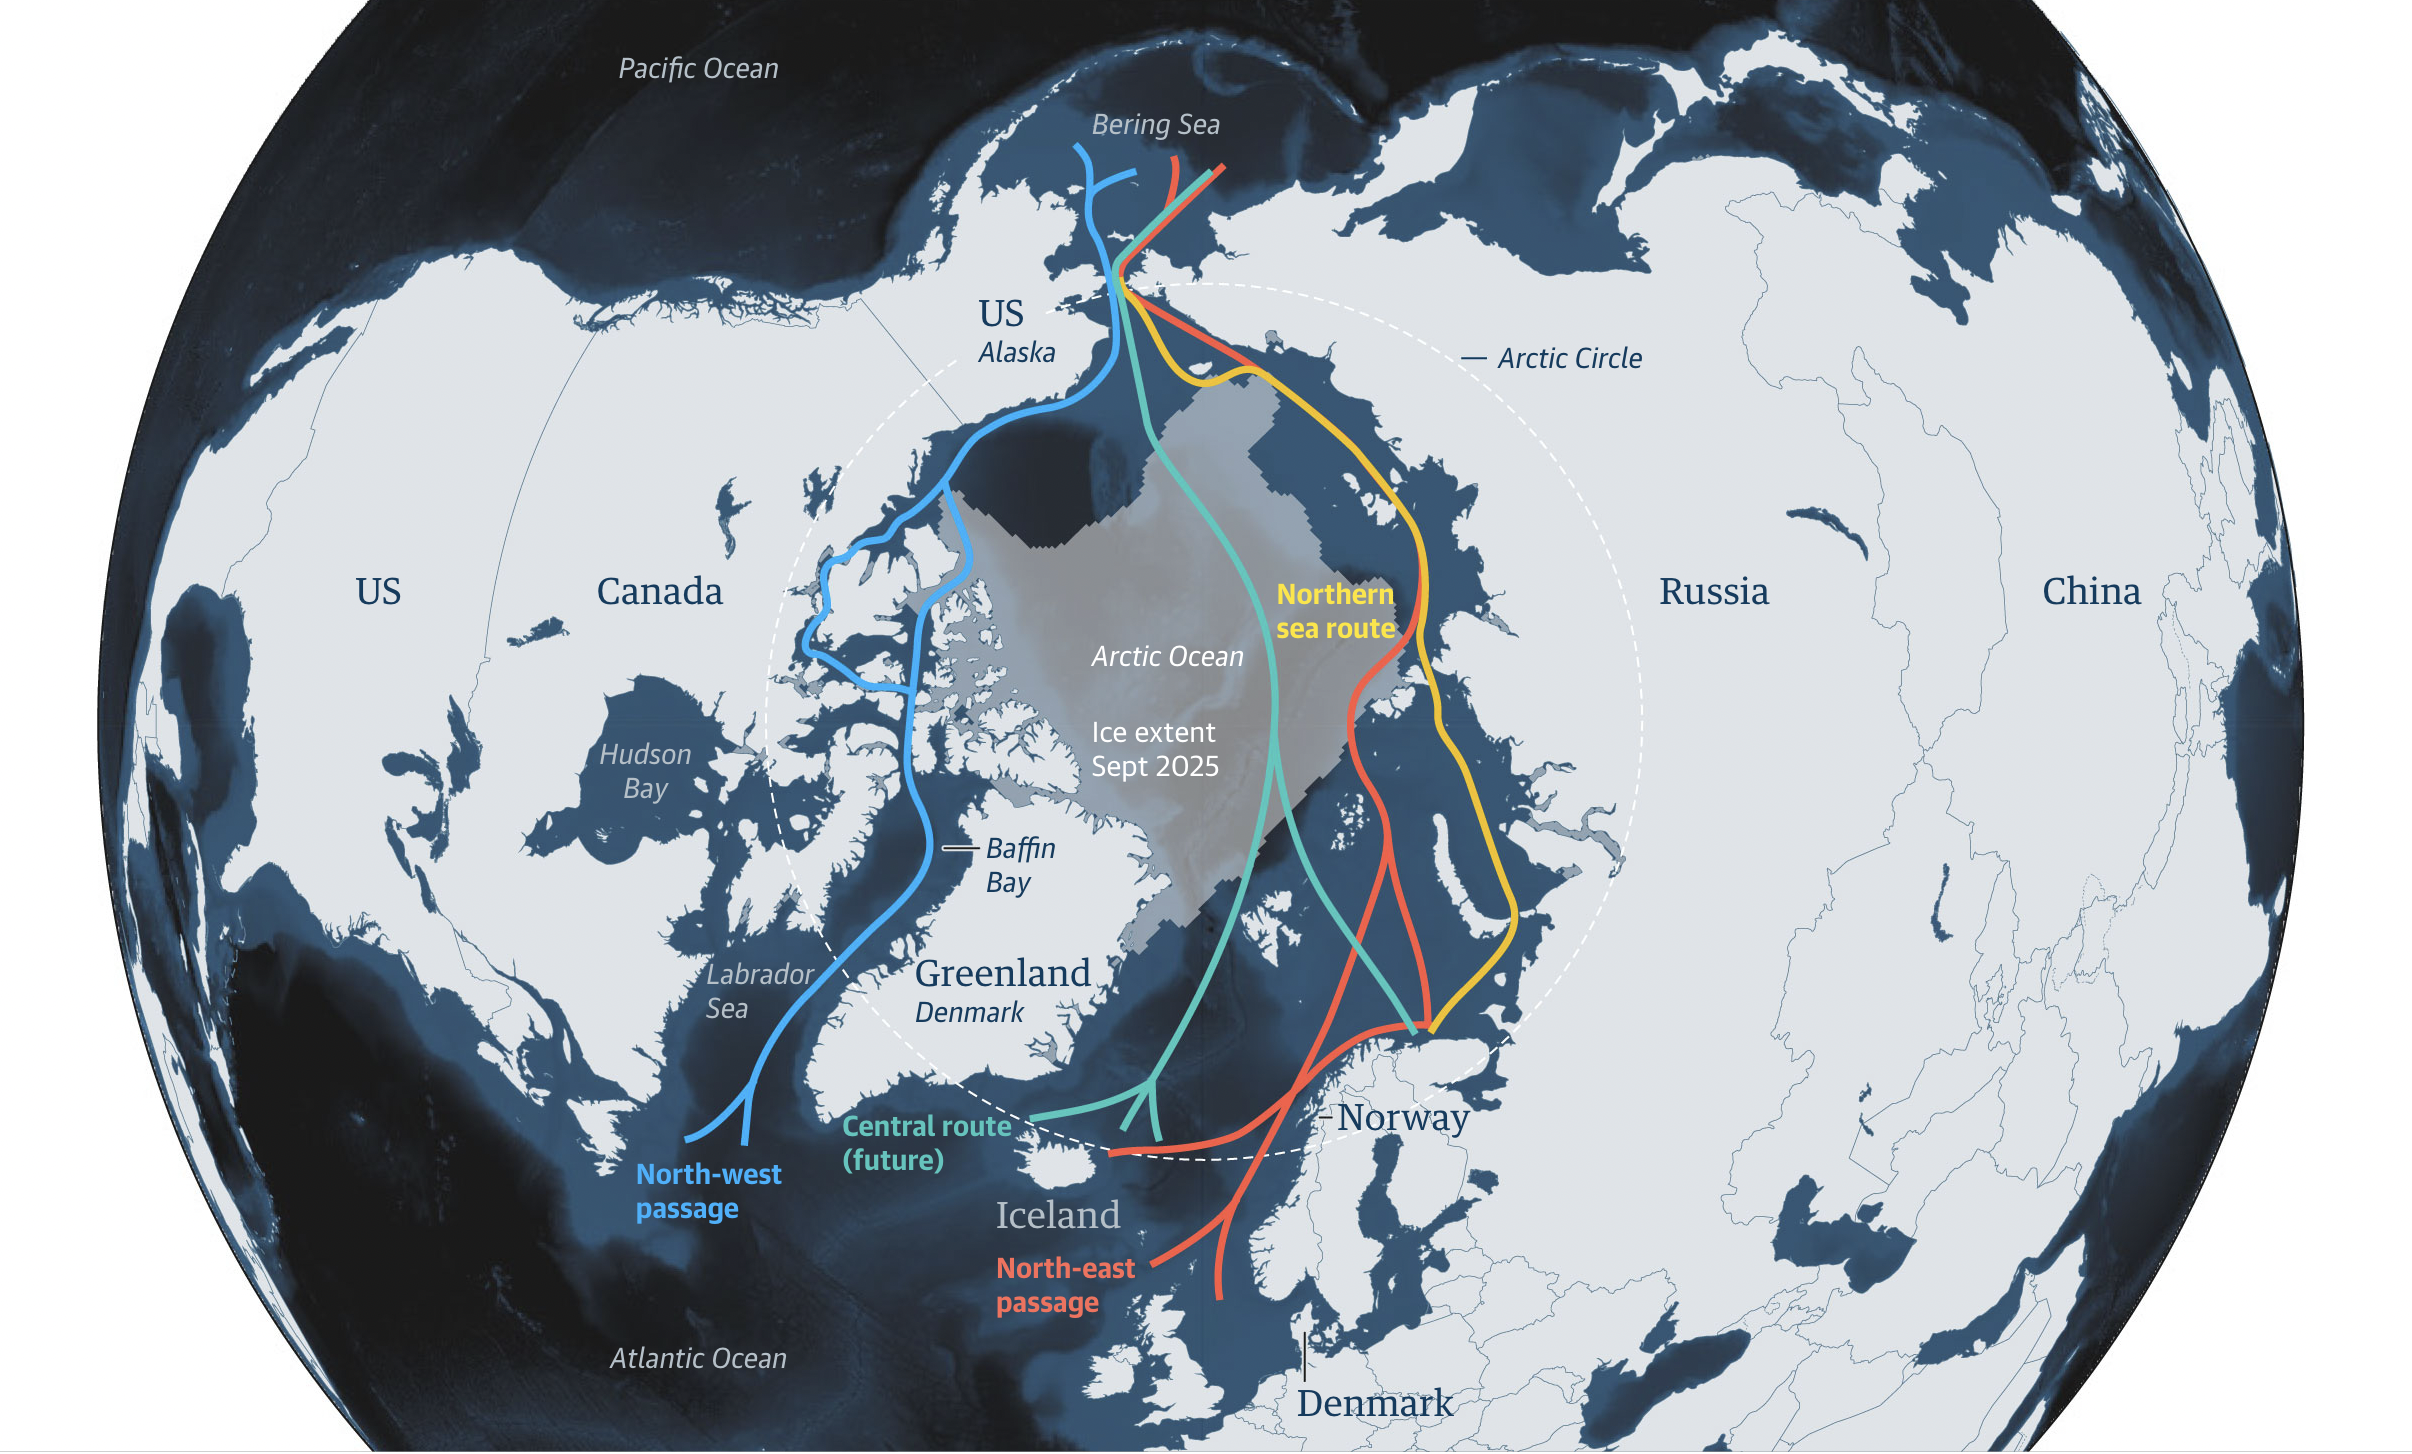
Image: Screenshot, The Guardian
As Arctic ice retreats, Greenland is emerging as both a commercial corridor and a subject of geopolitical tension. Using long-term sea-ice measurements from the National Snow and Ice Data Center, visuals show how shrinking ice cover is opening new seasonal shipping routes through waters once largely impassable. The Guardian drew on MarineTraffic and Marine Exchange of Alaska to track rising vessel movements, and overlaid claims, military installations, and radar sites to show how the US and Russia are positioning themselves in the region. It also incorporated figures from the US Geological Survey on Greenland’s rare-earth and critical mineral deposits, using charts and maps to link climate change, resource extraction, and security concerns.
Rise of Charging Stations in Flanders
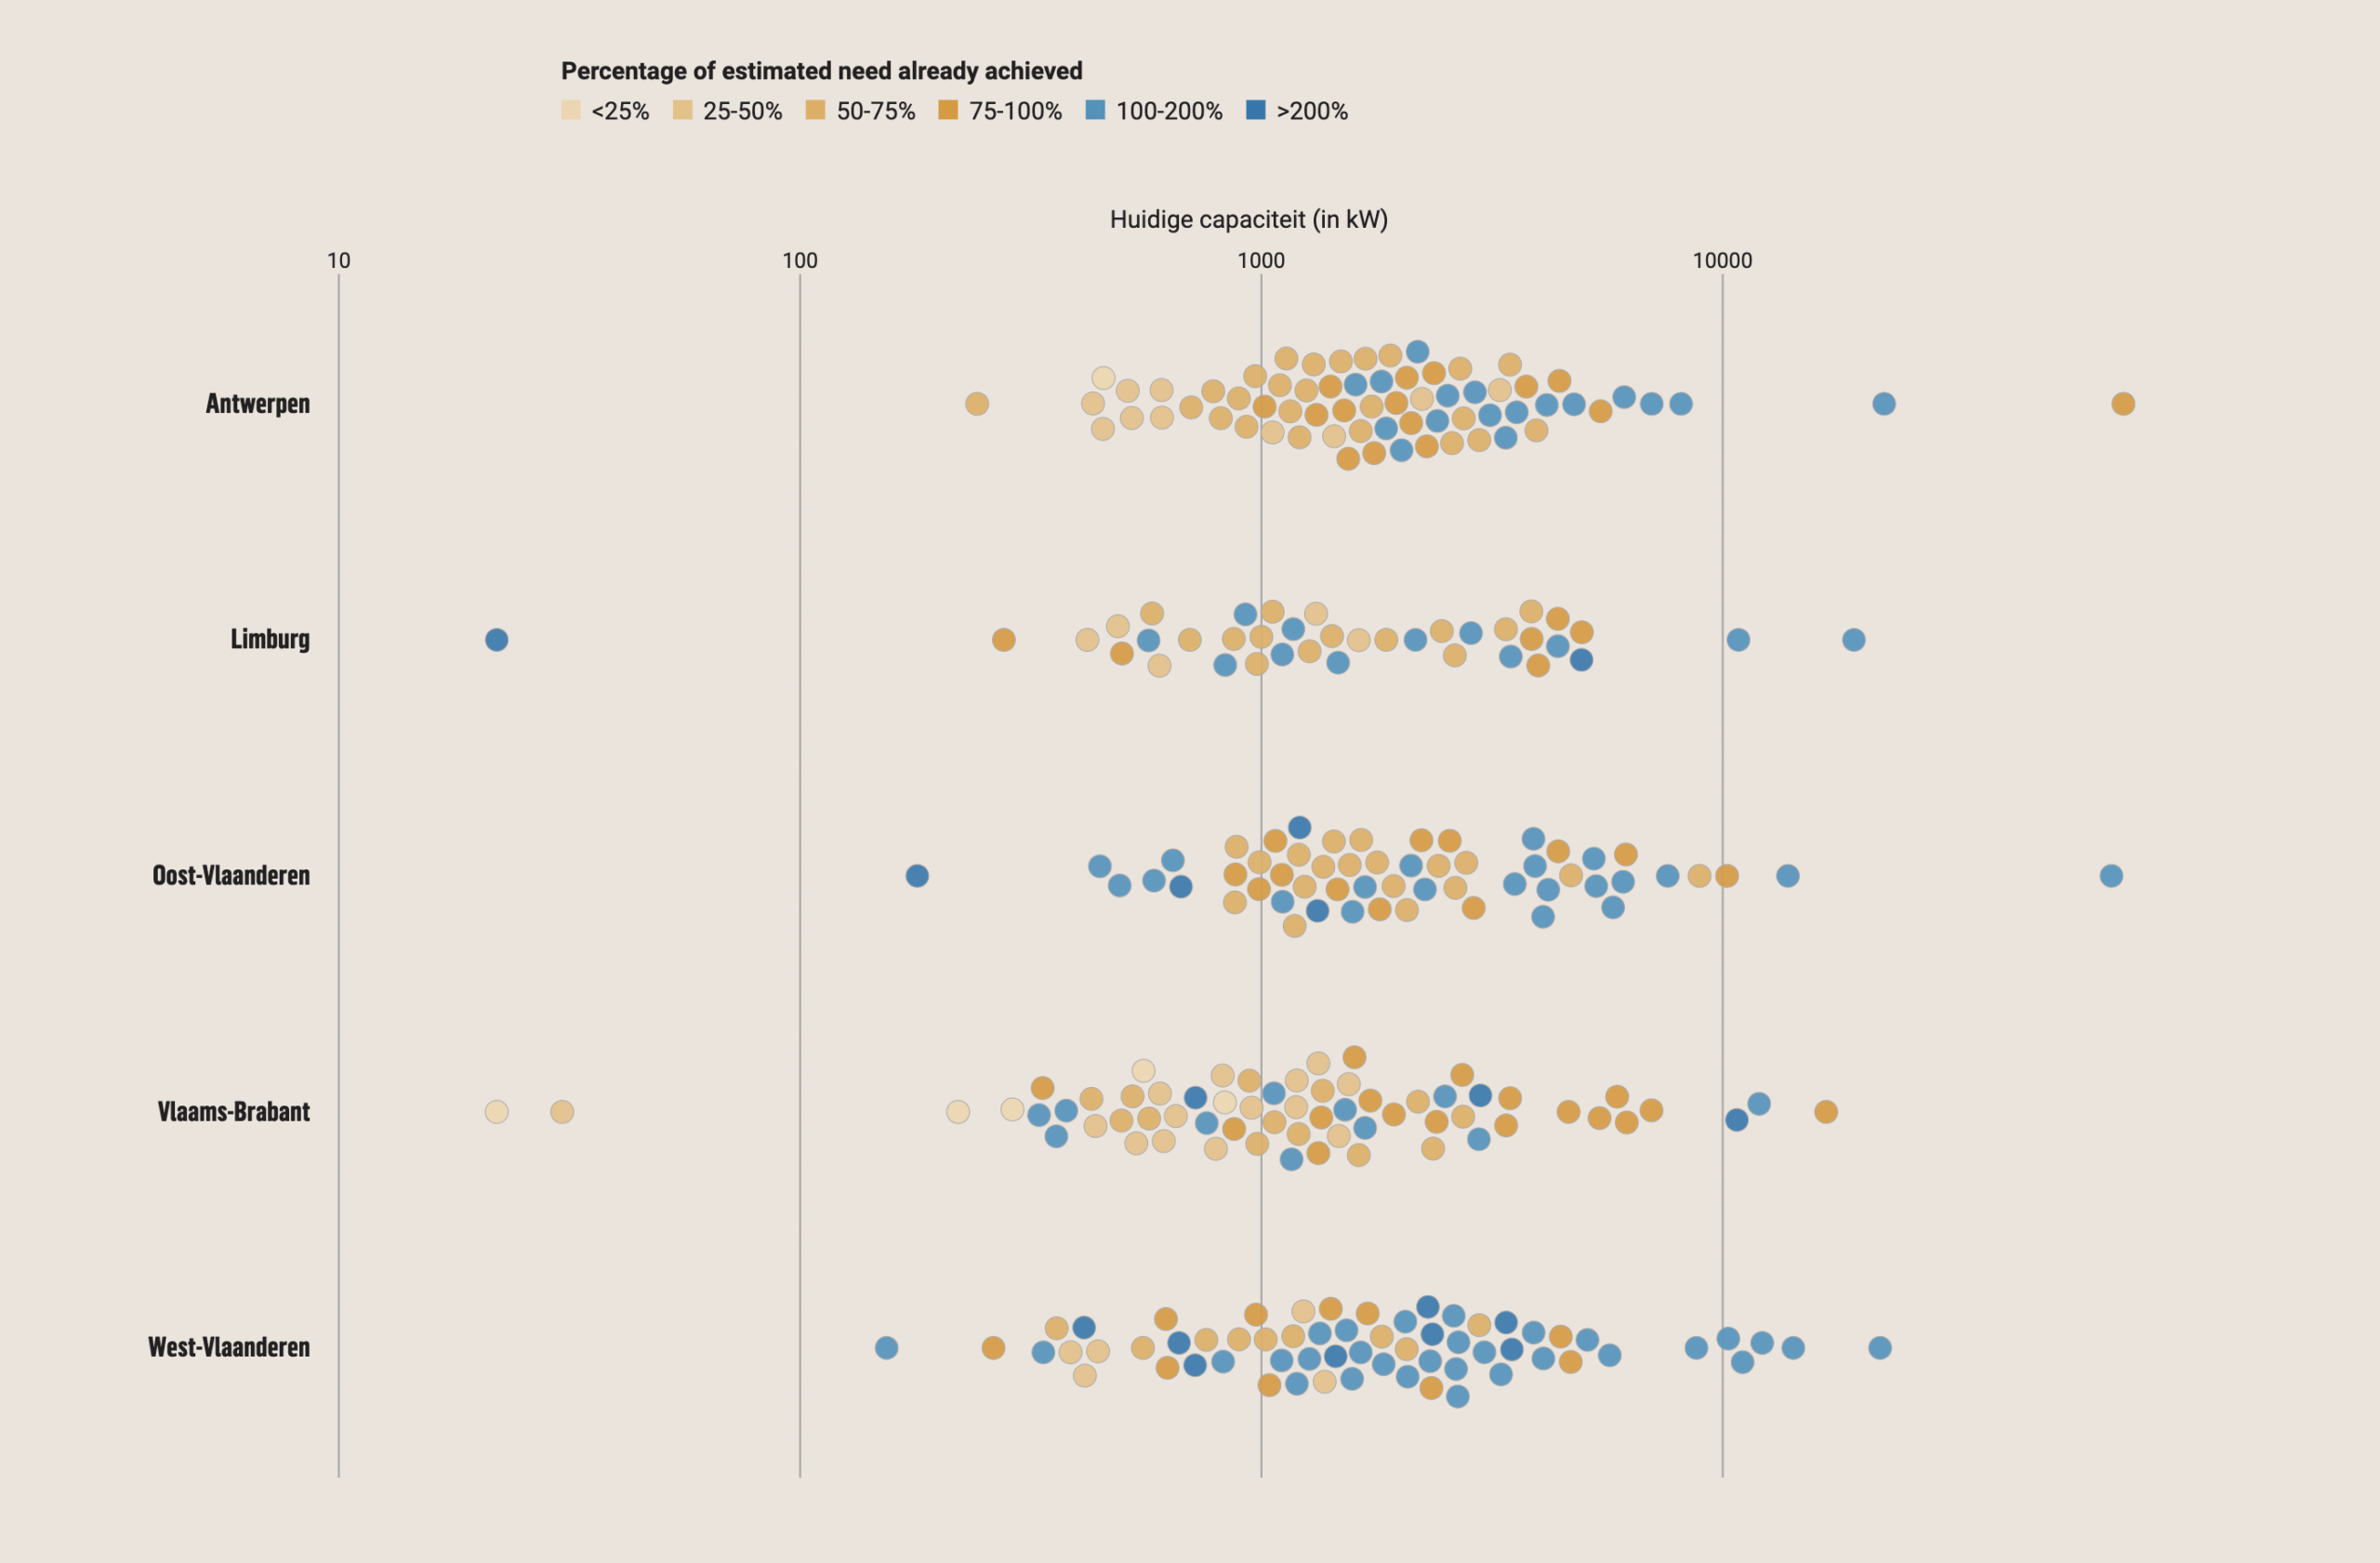
Image: Screenshot, De Tijd
Public charging infrastructure in Belgium’s northern Flanders region is expanding at record speed, according to a new analysis by De Tijd, based on data from the Flemish Department of Mobility and Public Works. The analysis showed that the number of publicly accessible charging points has grown nearly 10-fold in five years, reaching 72,646 by the end of 2025, driven by EV adoption, government subsidies, and rising interest from major operators. Using government maps and capacity-weighted calculations, the reporting distinguished between fully public and semi-public chargers and tracked charging speed as well as location. While standard chargers still dominate, visuals and time-series comparisons highlighted a rise in ultra-fast stations, revealing how infrastructure is shifting from city centers to regional roads and highways to keep pace with electrification.
New Map of Antarctica Beneath the Ice
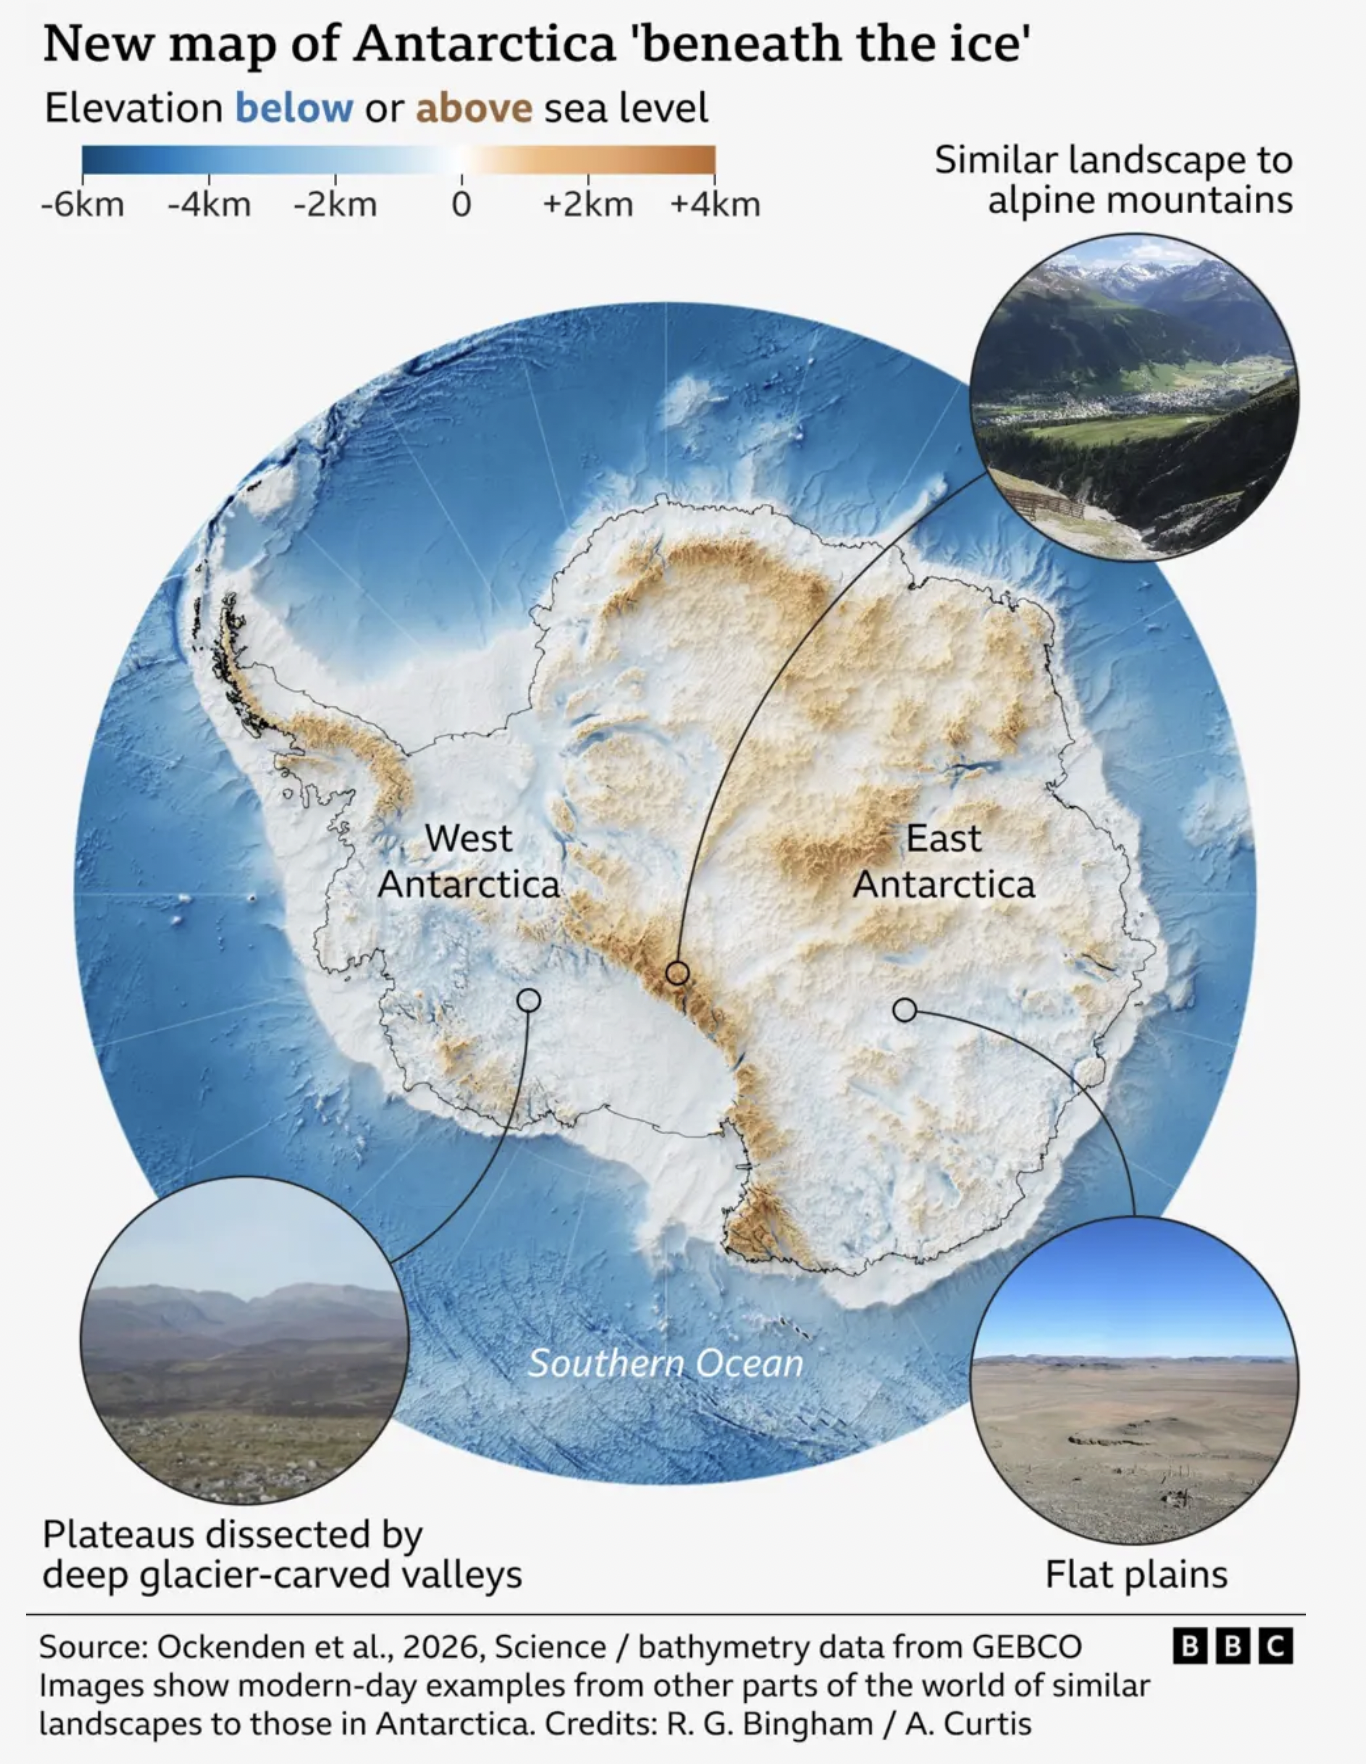
Image: Screenshot, BBC
A new study published in the academic journal Science has produced the most detailed map yet of the landscape beneath Antarctica’s ice, revealing thousands of previously unknown hills, ridges, and deep channels that shape how glaciers move. The research, reported by the BBC, used a new approach that combined satellite observations of the ice surface with physical models of ice flow. The results are presented through an interactive before-and-after slider that lets readers directly compare the new dataset with older maps, making the jump in detail immediately visible. Researchers say the improved mapping will help refine projections of ice loss and future sea-level rise.
Hanna Duggal is the writer of GIJN’s fortnightly Top 10 in Data Journalism column, and a data journalist at AJ Labs, the data, visual storytelling, and experiments team of Al Jazeera. She has reported on issues such as policing, surveillance, and protests using data, and reported for GIJN on data journalism in the Middle East, investigating algorithms onTikTok, and on using data to investigate tribal lands in the US.

Guide: Introduction to Investigative Journalism

No Coding Required: A Step-by-Step Guide to Scraping Websites With Data Miner

Investigating Cryptocurrency: Key Questions and Tips for Reporters

2025 Conference Resources

Iran’s Internet Blackouts, TikTok Health Misinformation, Visualizing Venezuela’s Oil, and a Fatal Shooting by ICE
Editor’s Pick: Best of Data Journalism from 2025

Data Cleaning Tools and Techniques for Non-Coders
Data Journalism in Asia: Rethinking the Relationships Between Newsrooms, Communities, and Evidence

This work is licensed under a Creative Commons Attribution-NoDerivatives 4.0 International License
Republish our articles for free, online or in print, under a Creative Commons license.
Republish this article
This work is licensed under a Creative Commons Attribution-NoDerivatives 4.0 International License
Read Next
Data Journalism Top 10
Iran’s Internet Blackouts, TikTok Health Misinformation, Visualizing Venezuela’s Oil, and a Fatal Shooting by ICE
Our round-up of the best in recent data journalism also highlights noise pollution in Singapore, India’s ditching of Bollywood romance movies, and a visual investigation into rocket debris.
Data Journalism Top 10 Editor's Picks
Editor’s Pick: Best of Data Journalism from 2025
Our roundup of standout data journalism from the past year highlights projects that delve into conflicts in the Middle East, Ukraine, and Africa, that explore the rise of AI, and interrogate global trade wars.
Data Journalism
Data Cleaning Tools and Techniques for Non-Coders
Understanding, organizing, and validating data directly affects the accuracy of stories. New tools make cleaning accessible to journalists without coding.
Asia Focus
Data Journalism in Asia: Rethinking the Relationships Between Newsrooms, Communities, and Evidence
Data storytelling newsrooms have found innovative approaches to navigate closed data regimes, political pressures, and resource gaps.