Data Journalism Top 10: Russia’s School Roads, Myanmar’s Rich Generals, Cameroon’s Deadly Gold Mines, Visualizing the Capitol Riot
Read this article in
In the wake of the terrorist attacks on September 11, 2001, the United States invaded Afghanistan to overthrow the Taliban. As the US prepares to withdraw its troops later this year, some are counting the toll of a 20-year war. Our NodeXL #ddj mapping from May 10 to 16, which tracks the week’s most popular data journalism stories on Twitter, found an interactive project by Al Jazeera showcasing the impact of a conflict that has directly claimed an estimated 241,000 lives. In this edition, we also feature an IStories piece on the difficulties Russian kids have getting to school, an InfoCongo investigation into deaths tied to gold mining, and a visual vocabulary for data projects by the Financial Times.
The Road to School in Russia
In Russia, tens of thousands of schoolchildren travel through snow, dust, and mud to get to the classroom, with many of them living more than 50 kilometers, or 30 miles, from the nearest institution. Sometimes the roads are so impassable they need to go on foot. IStories published this data-driven project featuring maps, images, and graphics to explain why in 2021 access to education remains difficult for so many Russian students.
Gold Mining Pits
At least 150 people have died after falling into the abandoned gold mining pits that dot Cameroon’s forests. A data investigation published by InfoCongo found that while deaths regularly occur in the country’s main gold mining regions, many of these sites have not been rehabilitated, presenting a danger for local communities.
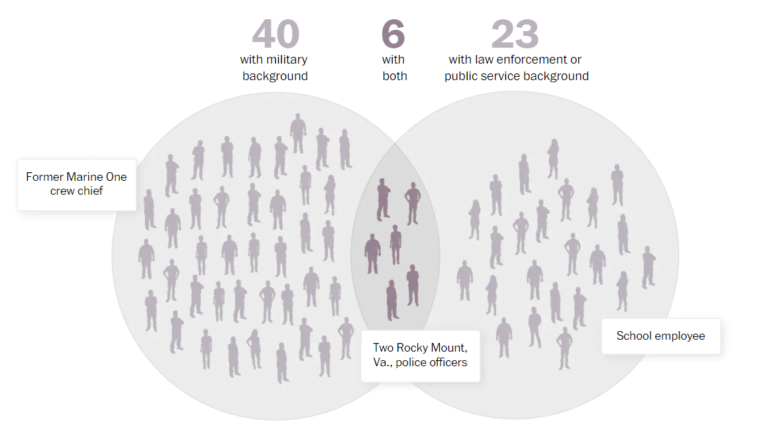
Capitol Riot Investigation
On January 6, far-right activists, white supremacists, and hardcore loyalists of then-President Donald Trump stormed the US Capitol in an attempt to overturn Joe Biden’s victory in the presidential election. The attack has prompted one of the most complex investigations in the country’s history, with more than 400 people were arrested. The Washington Post created a “deep-dive visualization” to detail what we know so far about the suspects and what they’ve been charged with.
Care Deaths
In the UK, hundreds of thousands of people receive nursing care at home. But an investigation by The Bureau of Investigative Journalism found that more than 25,000 people patients in this group — made up of the elderly, the disabled, and the sick — died during the coronavirus pandemic. Its data shows deaths among those receiving care at home more than doubled in England compared to the previous year, but received much less national attention than what was happening inside care homes themselves.
The Toll of a 20-Year War
Since the US invaded Afghanistan after the September 11, 2001 terrorist attacks, almost a quarter of a million people have died in circumstances directly linked to the conflict. Hundreds of thousands more have died due to hunger, disease, and injury. Al Jazeera produced a series of graphics to show the impact of two decades of conflict, highlighting how this is one of the most dangerous countries in the world for children.
Radicalization in Germany
The pandemic has accelerated the spread of hate speech and right-wing extremism through social media in Germany. The newspaper Süddeutsche Zeitung examined almost 12 million Telegram messages showing how conspiracy myths, agitation, and racism combine to form a toxic mixture in the networks. Some groups have pushed conspiracy ideologies and hatred since the beginning of the crisis. This online activity has also sparked aggressive behavior in the streets, which the newspaper highlights can no longer be overlooked.
Summer Heat
As climate change slowly impacts seasonal temperatures across the US, California has extended a drought emergency notice originally declared in April. Summer heat over the next few months could trigger more wildfires, which devastated parts of the state in recent years. The Financial Times examined data from the US Drought Monitor to illustrate the influence of global warming on the nation’s most populous state.
Myanmar’s Rich Generals
In February, Myanmar’s
The Polish Goal Machine
Robert Lewandowski, Bayern Munich’s prolific goalscorer, has had a sensational season in the German soccer league, the Bundesliga. Last weekend, the Polish striker scored his 40th goal in the campaign, equaling a long-standing record set by German legend Gerd Müller in 1972. Der Spiegel published a special graphics project to examine the numbers behind Lewandowski’s phenomenal achievement.
Visual Vocabulary
Working on a data visualization story? This Visual Vocabulary by the Financial Times’ data graphics team can help you choose the best design approach to make informative and meaningful charts and graphics. The guide covers everything from heat maps to boxplots.
Thanks again to Marc Smith and Harald Meier of Connected Action for gathering the links and graphing them. The Top Ten #ddj list is curated weekly.
 Peter Georgiev is GIJN’s social media and engagement editor. Previously, he was part of NBC News’ investigative unit in New York. He also worked as a correspondent for Bulgarian National Television and his reporting has been published by the Guardian, Deutsche Welle, and other international outlets.
For a look at NodeXL’s mapping on #ddj and data journalism on Twitter, check out this map.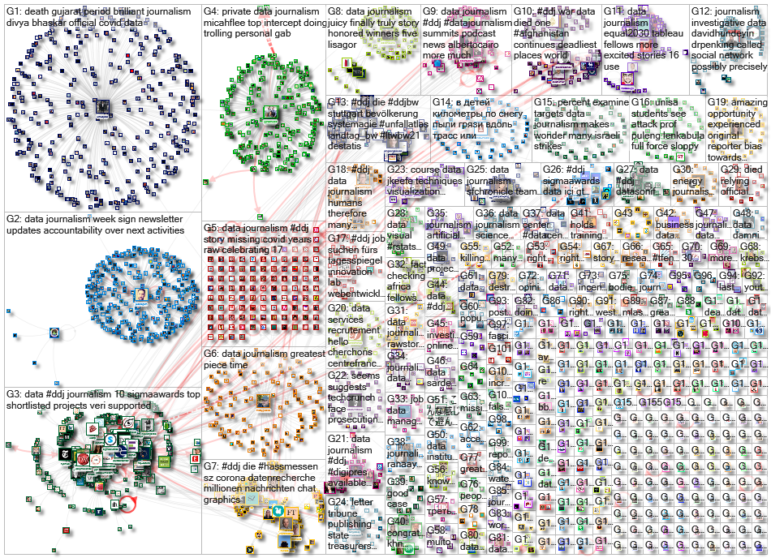

Reporter’s Guide to Investigating Cryptocurrency

Tipsheet on Partnering with Civil Society Organizations and Non-Governmental Organizations

AI Accountability Reporting Guide

Guide to Mapping Analysis Using QGIS

Turning the Threat to a Distant Glacier into a Local Story Through Data Visualization

How The Pudding Used Data Visualizations to Recontextualize the Story of Climate Change

Using Data Sources to Track Harmful Climate Crisis-Fueled Algal Blooms

Lessons Learned: 10 Common Mistakes in Data Journalism

This work is licensed under a Creative Commons Attribution-NoDerivatives 4.0 International License
Republish our articles for free, online or in print, under a Creative Commons license.
Republish this article
This work is licensed under a Creative Commons Attribution-NoDerivatives 4.0 International License
Read Next
Climate Data Journalism
Turning the Threat to a Distant Glacier into a Local Story Through Data Visualization
New York Times climate and environmental graphics reporter Mira Rojanasakul discusses how her team visualized the sea level rise threat from the melting Thwaites Glacier in Antarctica.
Climate Data Journalism
How The Pudding Used Data Visualizations to Recontextualize the Story of Climate Change
What does climate change feel like? How will your city’s climate shift, 50 years from now? Data scientist Derek Taylor explains his latest piece.
Data Journalism Reporting Tools & Tips
Using Data Sources to Track Harmful Climate Crisis-Fueled Algal Blooms
For the SEJ’s Reporter’s Toolbox: datasets and sources useful for tracking the harmful impact of climate change-fueled algal blooms.
Data Journalism News & Analysis
Lessons Learned: 10 Common Mistakes in Data Journalism
GIJN asked speakers and attendees in the NICAR conference hallways for the data journalism gaps they see and for under-covered topic areas newsrooms can address.